. 2014 Jul;7(7):552-64.
doi: 10.1002/jbio.201200187. Epub 2012 Dec 14.

Measuring tumor cycling hypoxia and angiogenesis using a side-firing fiber optic probe

Affiliations

Measuring tumor cycling hypoxia and angiogenesis using a side-firing fiber optic probe

Bing Yu et al. J Biophotonics. 2014 Jul.

Abstract

Hypoxia and angiogenesis can significantly influence the efficacy of cancer therapy and the behavior of surviving tumor cells. There is a growing demand for technologies to measure tumor hypoxia and angiogenesis temporally in vivo to enable advances in drug development and optimization. This paper reports the use of frequency-domain photon migration with a side-firing probe to quantify tumor oxygenation and hemoglobin concentrations in nude rats bearing human head/neck tumors administered with carbogen gas, cycling hypoxic gas or just room air. Significant increase (with carbogen gas breathing) or decrease (with hypoxic gas breathing) in tumor oxygenation was observed. The trend in tumor oxygenation during forced cycling hypoxia (CH) followed that of the blood oxygenation measured with a pulse oximeter. Natural CH was also observed in rats under room air. The studies demonstrated the potential of the technology for longitudinal monitoring of tumor CH during tumor growth or in response to therapy.

Keywords: Diffuse optical spectroscopy; cancer therapy; fiber optic sensor; tumor hypoxia and angiogenesis.


Figures

Figure 1
Figure 1
(online color at: www.biophotonics-journal.org) FDPM instrument and side-firing probe: (a) photograph of the instrument; (b) a schematic of the side-firing fiber optic probe; and (c) a cartoon of the coupling between the side-firing probe and rat tumor.
Figure 2
Figure 2
(online color at: www.biophotonics-journal.org) Photograph of a rat with a side-firing probe attached.
Figure 3
Figure 3
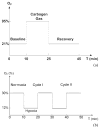
Experimental procedures for (a) carbogen (95% O2 and 5% CO2) inhalation and (b) for cycling hypoxic gas breathing (30% O2 was used for normoxia instead of 21%).
Figure 4
Figure 4
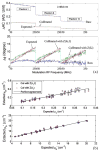
(online color at: www.biophotonics-journal.org) Phantom results: (a) Raw and calibrated relative amplitude and phase spectra (in frequency domain) for phantoms #1, 8 and 15. (b) Extracted v.s. expected μa and μs at all wavelengths for all phantoms. The errors for μa and μs extraction are 9.4 ± 2.8% and 3.4 ± 1.4% with frequency dependent phase calibration and 14.6 ± 7.7% and 7.3 ± 1.4% with frequency independent phase calibration, respectively.
Figure 5
Figure 5
Boxplots of baseline (a) SO2 and (b) THb for tumors and controls in the carbogen gas and forced CH studies.
Figure 6
Figure 6
(a) SO2 and (b) THb measured from Rat #5 in pre-, during and post carbogen inhalation.
Figure 7
Figure 7
Boxplots of changes in (a) SO2 and (b) THb from the first baseline datapoint (t = 0 minute) for all 8 rats in the carbogen inhalation study.
Figure 8
Figure 8
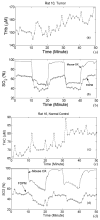
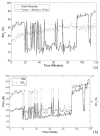
Typical THb and SO2 measured in the forced CH study from a rat tumor (Rat #10, (a) and (b)) and a normal control (Rat #16, (c) and (d)).
Figure 9
Figure 9
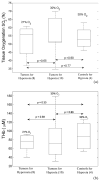
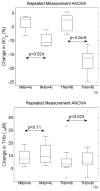
Boxplots of changes (from the 1st data point) in (a) SO2 and (b) THb for normal tissue during normoxia (NN), normal tissue during hypoxia (NH), tumor tissue during normoxia (TN) and tumor tissue during hypoxia (TH). The normoxia (NN and TN) includes all the data points collected under 30% O2 supply and the hypoxia (NH and TH) includes all data points measured under 12% O2 supply.
Figure 10
Figure 10
Results measured from the rat in Group 3A: (a) Tissue oxygenation measured from the right flank muscles and at a tumor size of 2 cm × 1.7 cm on the left flank; and (b) tumor total hemoglobin concentration and oxygenation measured concurrently.
Figure 11
Figure 11
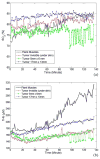
(online color at: www.biophotonics-journal.org) Tissue SO2 (a) and THb (b) measured from the rat in Group 3B before tumor cells were injected and at three different tumor sizes.

References

    1. Serganova I, Humm J, Ling C, Blasberg R. Clin Cancer Res. 2006;12(18):5260–5264. - PubMed
    1. Dewhirst MW, Cao Y, Moeller B. Nat Rev Cancer. 2008;8(6):425–437. - PMC - PubMed
    1. Brey EM, King TW, Johnston C, McIntire LV, Reece GP, Patrick CW., Jr Microvasc Res. 2002;63(3):279–294. - PubMed
    1. Cao Y, Li CY, Moeller BJ, Yu D, Zhao Y, Dreher MR, Shan S, Dewhirst MW. Cancer Res. 2005;65(13):5498–5505. - PubMed
    1. Moeller BJ, Dreher MR, Rabbani ZN, Schroeder T, Cao Y, Li CY, Dewhirst MW. Cancer Cell. 2005;8(2):99–110. - PubMed

Publication types

MeSH terms