. 2013 Apr;30(4):737-51.
doi: 10.1093/molbev/mss279. Epub 2012 Dec 12.

The adaptation of temperate bacteriophages to their host genomes

Affiliations

The adaptation of temperate bacteriophages to their host genomes

Louis-Marie Bobay et al. Mol Biol Evol. 2013 Apr.

Abstract

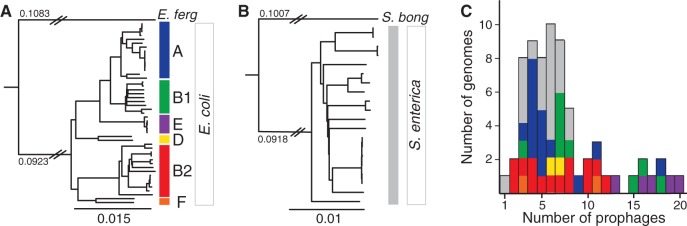
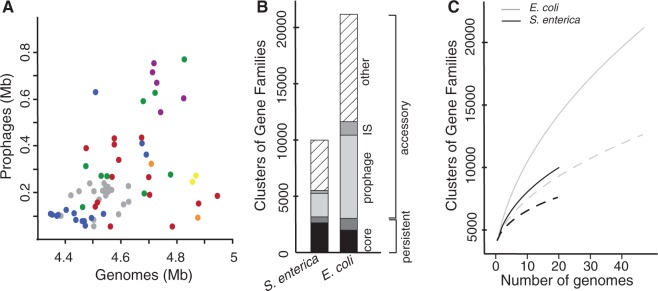
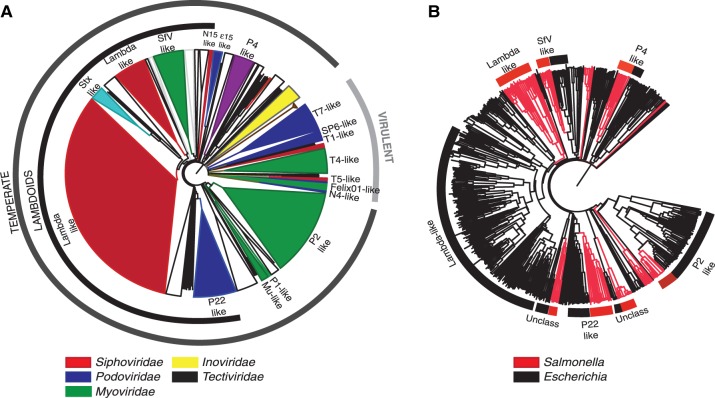
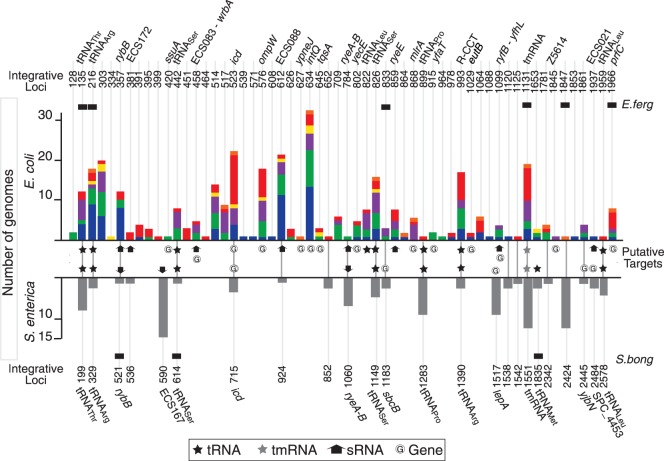
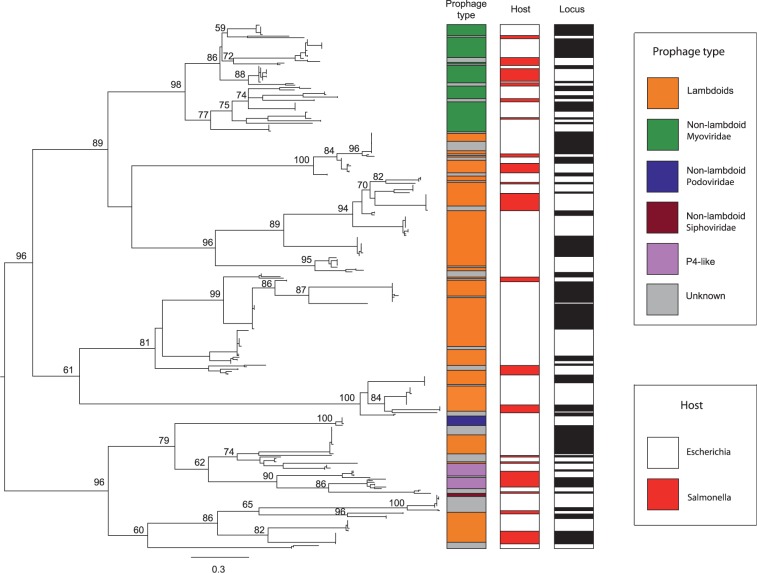
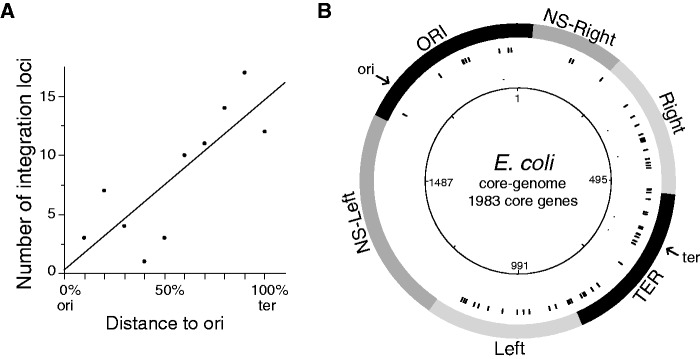
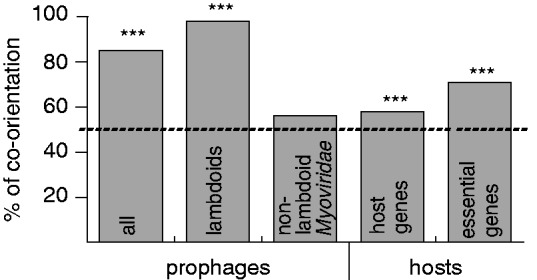
Rapid turnover of mobile elements drives the plasticity of bacterial genomes. Integrated bacteriophages (prophages) encode host-adaptive traits and represent a sizable fraction of bacterial chromosomes. We hypothesized that natural selection shapes prophage integration patterns relative to the host genome organization. We tested this idea by detecting and studying 500 prophages of 69 strains of Escherichia and Salmonella. Phage integrases often target not only conserved genes but also intergenic positions, suggesting purifying selection for integration sites. Furthermore, most integration hotspots are conserved between the two host genera. Integration sites seem also selected at the large chromosomal scale, as they are nonrandomly organized in terms of the origin-terminus axis and the macrodomain structure. The genes of lambdoid prophages are systematically co-oriented with the bacterial replication fork and display the host high frequency of polarized FtsK-orienting polar sequences motifs required for chromosome segregation. matS motifs are strongly avoided by prophages suggesting counter selection of motifs disrupting macrodomains. These results show how natural selection for seamless integration of prophages in the chromosome shapes the evolution of the bacterium and the phage. First, integration sites are highly conserved for many millions of years favoring lysogeny over the lytic cycle for temperate phages. Second, the global distribution of prophages is intimately associated with the chromosome structure and the patterns of gene expression. Third, the phage endures selection for DNA motifs that pertain exclusively to the biology of the prophage in the bacterial chromosome. Understanding prophage genetic adaptation sheds new lights on the coexistence of horizontal transfer and organized bacterial genomes.


Figures

F<sc>ig</sc>. 1.
Fig. 1.
Core genome phylogenies and prophage content of Escherichia and Salmonella. (A) Maximum likelihood phylogenetic tree of the 47 Escherichia coli strains. (B) Maximum likelihood phylogenetic tree of the 20 Salmonella enterica strains. Escherichia fergusonii and S. bongori were used to root the trees of each species. The branch length separating E. fergusonii from the E. coli strains is not to scale (same for S. bongori); the numbers above the branch indicate the respective substitution rates per site. All nodes of the trees were supported with high bootstrap values (>97%), the few exceptions correspond to some terminal branches connecting very closely related strains. Phylogenetic groups of the strains are indicated with colors on the right part of each panel. (C) Distribution of the number of prophages per genome. Colors correspond to the phylogenetic groups of panels A and B.
F<sc>ig</sc>. 2.
Fig. 2.
Contribution of prophages to chromosome plasticity. (A) Scatter plot of cumulative size of resident prophages against the size of the host genome (Spearman's ρ = 0.52, P < 0.0001). Colors correspond to the phylogenetic groups as in figure 1. (B) Fraction of the core, persistent, and accessory genes in the pan genome of Salmonella enterica (left) and Escherichia coli (right). The core genome corresponds to the genes present in all strains, the persistent genome to the genes present in more than 90% of the strains. The accessory genome is split in three categories: the prophages, the insertion, sequences (IS), and the other genes. (C) Escherichia coli (in gray) and S. enterica (in black) pan genomes according to the number of sequenced genomes. The dotted lines correspond to pan genomes after removing prophage elements.
F<sc>ig</sc>. 3.
Fig. 3.
Classification of prophages. (A) Phylogenetic tree of phages and prophages based on gene repertoire relatedness (see Materials and Methods). Phage/prophage families are colored according to the color key. The phage/prophage genus is indicated in the inner circle. The members of the “lambdoid” group are indicated in the second circle. The classification of phages/prophages into temperate and virulent is indicated in the third circle. White clusters correspond to unclassified clades. (B) Phylogenetic tree as in (A) but restricted to temperate phages/prophages. Red branches correspond to Salmonella phages/prophages and black branches to Escherichia phages/prophages. Labels indicate some types of phages/prophages of interest and mentioned in the text.
F<sc>ig</sc>. 4.
Fig. 4.
Distribution of prophages at integration hotspots. The x axis indicates the position of the hotspots of phage integration in the genomes of Escherichia coli (top) and Salmonella enterica (bottom). The positions of the “integrative loci” (on top for E. coli and bottom for S. enterica) are indicated as positions in the core genome. For example, position 634 in E. coli refers to prophages integrated 3′ of the 634th core gene in the reference genome of E. coli (MG1655 see Materials and Methods). The bars indicate the number of genomes with at least one prophage integrated among E. coli (top) and S. enterica (bottom). Colors in the bars correspond to the phylogenetic group of the genomes as in figure 1. The presence of prophages in E. fergusonii and in S. bongori is represented by a black rectangle above (respectively below) the bars of E. coli (respectively S. enterica). The 19 integrative loci conserved between E. coli and S. enterica genomes are connected in the middle of the figure. “Putative targets” of integration are also indicated in the middle part of the figure (details in the keys). The identification of tRNA (amino acid), sRNA, and protein coding genes are reported at the top and the bottom of the graphs, next to the indication of the flanking core gene (details in supplementary table S3, Supplementary Material online).
F<sc>ig</sc>. 5.
Fig. 5.
Phylogeny of the integrases. The maximum likelihood tree was made from a trimmed alignment of 332 tyrosine recombinases and rooted using the midpoint root. Bootstrap values (out of 1,000 replicates) are given in percents in the tree and are shown when exceeding 50%. Prophage types are indicated in the first column. The species hosting the prophage is shown in the second column. The third column shows that blocks of closely related integrases correspond to phages integrated at the same loci. One given block puts together a given number of integrases that are together in the phylogenetic tree and are associated with a single locus.
F<sc>ig</sc>. 6.
Fig. 6.
Distribution of prophages in the chromosome. (A) Number of loci with prophages in function of the distance to the origin of replication. Distribution of integration loci in function of the distance to the origin of replication (ori: origin and ter: terminus). (B) Circular representation of the distribution of the prophages in function of the macrodomains of Escherichia coli. Circles represent the following (from the inside out): 1, position in the core genome; 2, location of the integration locus; and 3, location of the four macrodomains and the two nonstructured (NS-right and NS-left) domains of the E. coli chromosome.
F<sc>ig</sc>. 7.
Fig. 7.
Percentage of prophages and host genes co-oriented with the replication fork. The dotted line shows the polarization under random expectation (50%). P < 0.05 (*); P < 0.01 (**); P < 0.001 (***).

Similar articles

Cited by

References

    1. Abedon ST, Calendar RL. The bacteriophages. New York: Oxford University Press; 2005.
    1. Abedon ST, Lejeune JT. Why bacteriophage encode exotoxins and other virulence factors. Evol Bioinform Online. 2005;1:97–110. - PMC - PubMed
    1. Ackermann HW. Salmonella phages examined in the electron microscope. Methods Mol Biol. 2007;394:213–234. - PubMed
    1. Allison GE, Angeles D, Tran-Dinh N, Verma NK. Complete genomic sequence of SfV, a serotype-converting temperate bacteriophage of Shigella flexneri. J Bacteriol. 2002;184:1974–1987. - PMC - PubMed
    1. Altschul SF, Madden TL, Schaffer AA, Zhang J, Zhang Z, Miller W, Lipman DJ. Gapped BLAST and PSI-BLAST: a new generation of protein database search programs. Nucleic Acids Res. 1997;25:3389–3402. - PMC - PubMed

Publication types

MeSH terms