. 2013 Feb 7;121(6):e5-e13.
doi: 10.1182/blood-2012-04-422394. Epub 2012 Dec 12.

Ontogeny of erythroid gene expression

Affiliations

Ontogeny of erythroid gene expression

Paul D Kingsley et al. Blood. .

Abstract

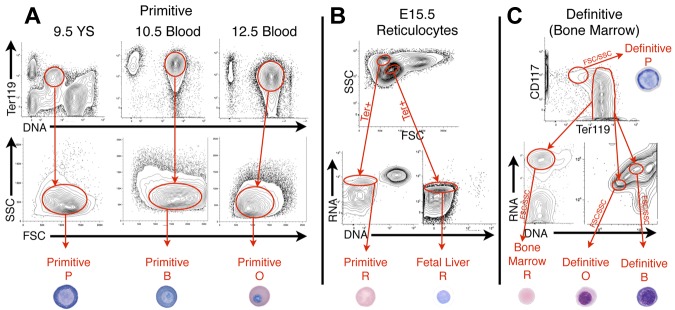
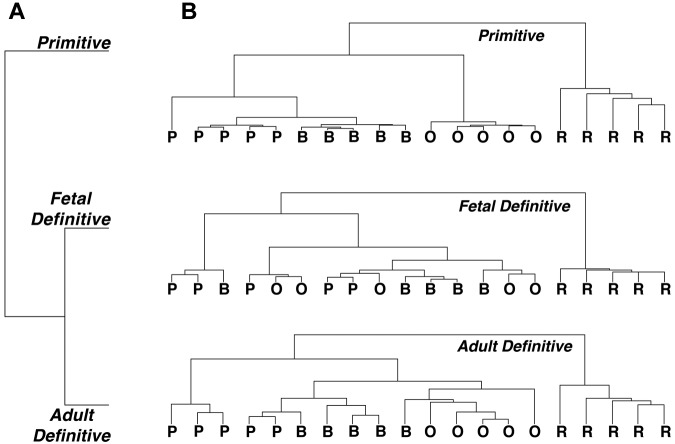
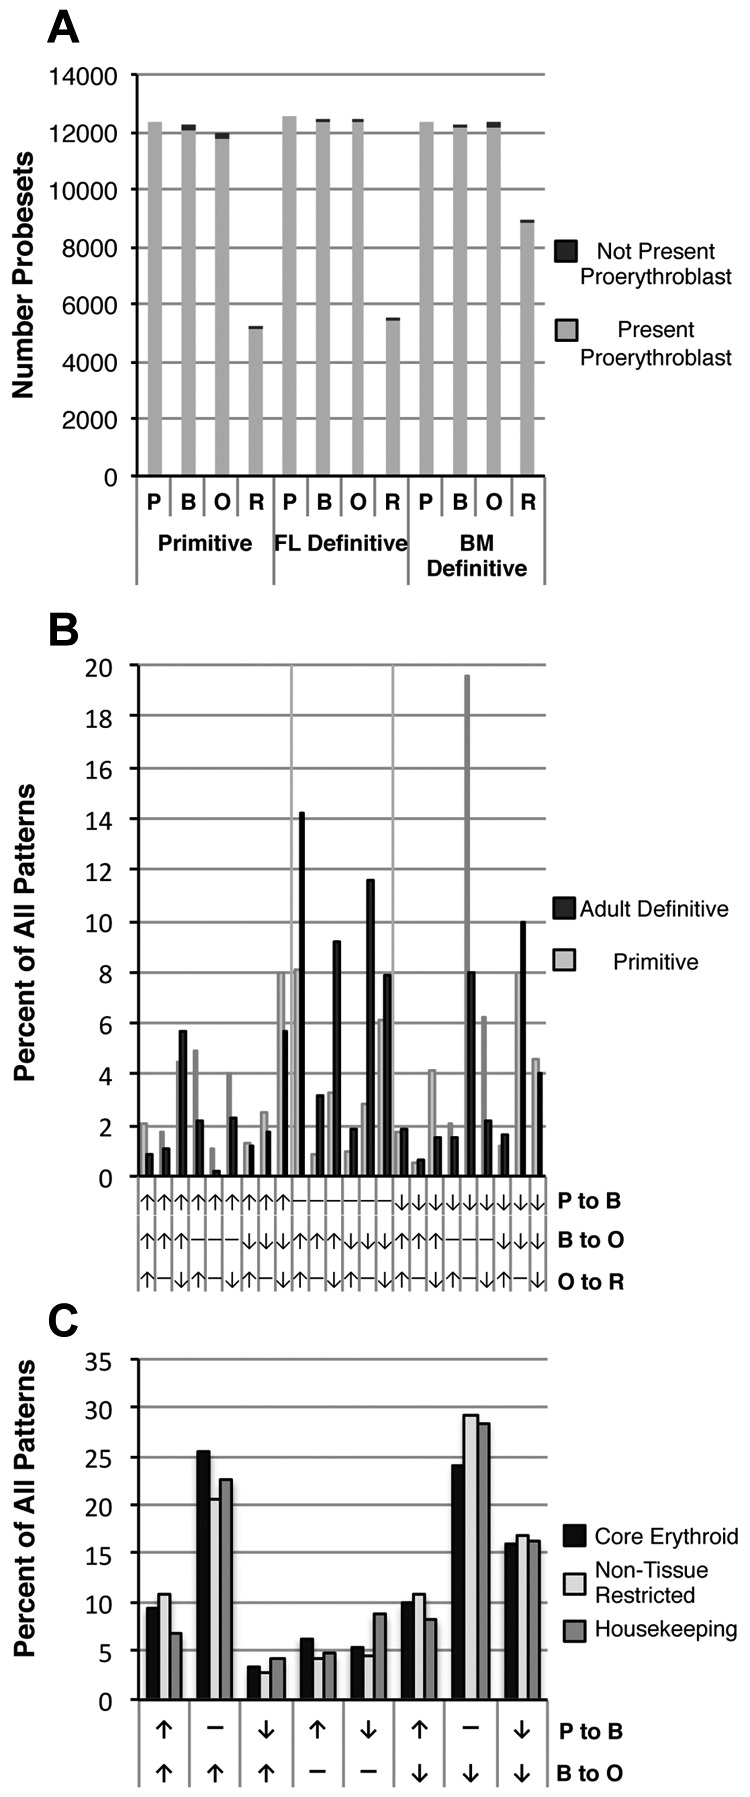
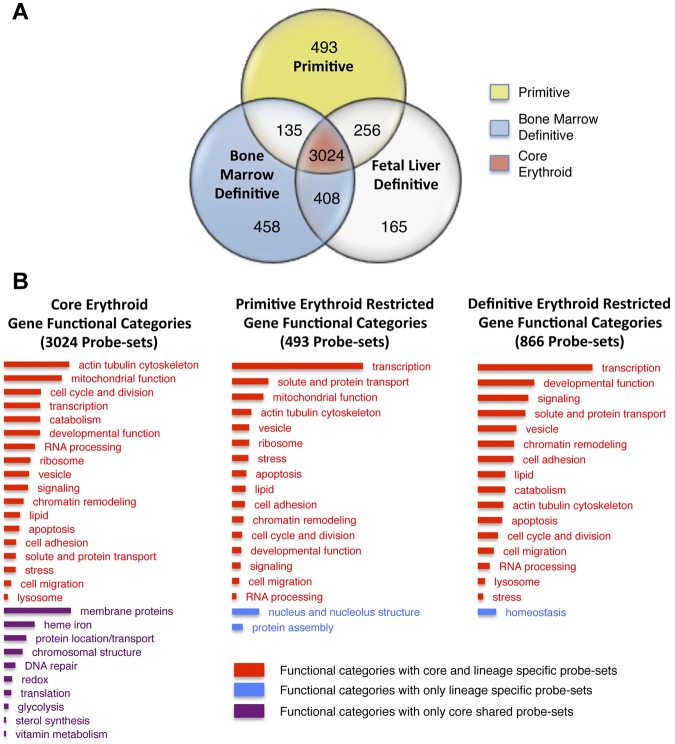
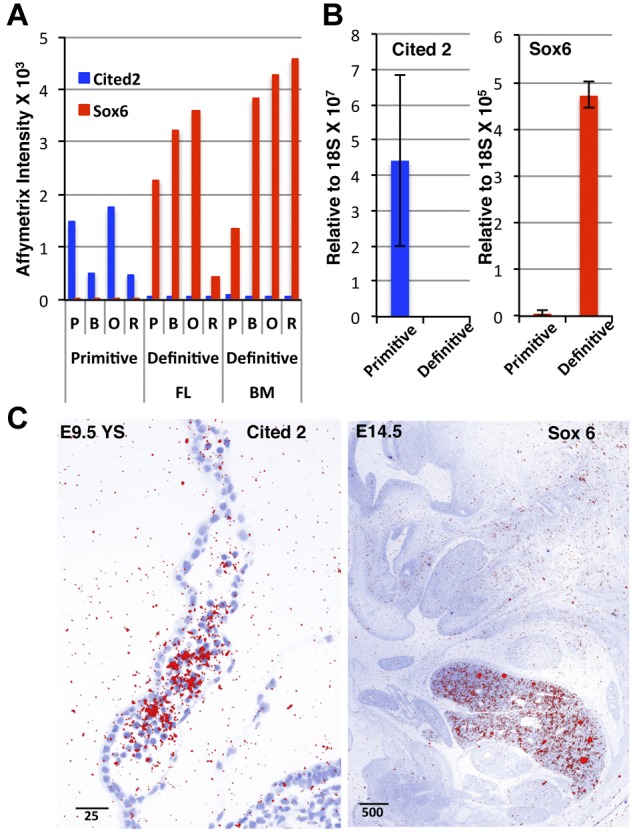
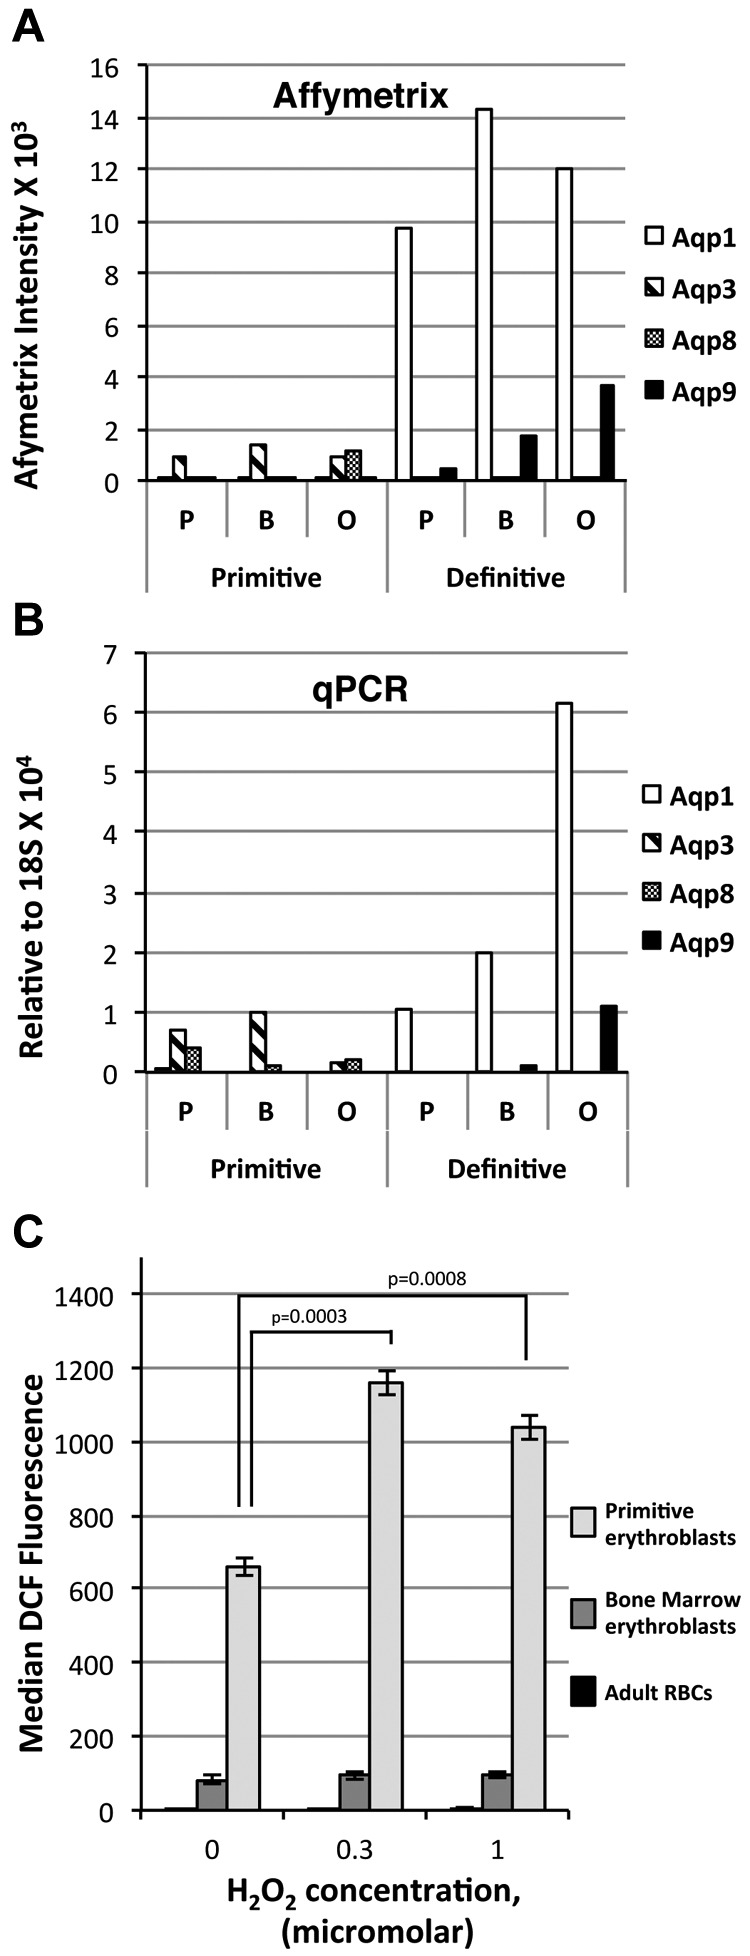
Erythroid ontogeny is characterized by overlapping waves of primitive and definitive erythroid lineages that share many morphologic features during terminal maturation but have marked differences in cell size and globin expression. In the present study, we compared global gene expression in primitive, fetal definitive, and adult definitive erythroid cells at morphologically equivalent stages of maturation purified from embryonic, fetal, and adult mice. Surprisingly, most transcriptional complexity in erythroid precursors is already present by the proerythroblast stage. Transcript levels are markedly modulated during terminal erythroid maturation, but housekeeping genes are not preferentially lost. Although primitive and definitive erythroid lineages share a large set of nonhousekeeping genes, annotation of lineage-restricted genes shows that alternate gene usage occurs within shared functional categories, as exemplified by the selective expression of aquaporins 3 and 8 in primitive erythroblasts and aquaporins 1 and 9 in adult definitive erythroblasts. Consistent with the known functions of Aqp3 and Aqp8 as H2O2 transporters, primitive, but not definitive, erythroblasts preferentially accumulate reactive oxygen species after exogenous H2O2 exposure. We have created a user-friendly Web site (http://www.cbil.upenn.edu/ErythronDB) to make these global expression data readily accessible and amenable to complex search strategies by the scientific community.


Figures

Figure 1
Figure 1
Isolation of primitive and definitive erythroid cells at specific stages of maturation. (A) Because primitive erythroid cells mature semisynchronously, progressive cell stages were isolated from E9.5 yolk sacs (proerythroblasts, P), E10.5 blood (basophilic erythroblasts, B), E12.5 blood (polychromatic/orthochromatic erythroblasts, O), and E15.5 blood (reticulocytes, R, using Ter119 expression, DNA content, and FSC/SSC characteristics. (B) Co-circulating primitive and fetal definitive reticulocytes were isolated from E15.5 blood using FSC/SSC characteristics, Ter119 expression, RNA content (Thiazole Orange, TO), and lack of DNA (VybrantViolet, VV), as described previously. (C) Definitive erythroblasts were isolated from BM (shown) and fetal liver (not shown), using Ter119lokit+ for P, Ter119+, VVhigherTOhigher for B, VVlowerTOlower for O, and Ter119+TO+VV for R. A representative example of each primitive and definitive erythroid cell is shown.
Figure 2
Figure 2
Clustering diagrams indicating reproducibility of replicate samples. (A) Definitive erythroid lineages cluster more closely to each other than to the primitive erythroid lineage. (B) Reproducibility of primitive and BM definitive erythroid sample replicates clearly separates the replicates by maturational stage. Fetal definitive erythroid replicate samples are less clearly resolved, with only the reticulocyte stage clearly separated from the erythroblast stages. P indicates proerythroblast; B, basophilic erythroblast; O, polychromatophilic/orthochromatic erythroblasts; and R, reticulocyte.
Figure 3
Figure 3
Patterns of gene expression during erythroid precursor maturation. (A) The number of Affymetrix probe sets expressed in each of the 3 erythroid datasets is similar and decreases between the polychromatophilic/orthochromatic erythroblast (O) and reticulocyte (R) stages. Light gray indicates probe sets initially present in proerythroblasts (P), black indicates probe sets present at each subsequent stage that were not present in proerythroblasts. (B) Probe sets were classified by changes in levels between erythroblast stages during primitive erythroid (gray bars) and adult definitive erythroid (black bars) maturation. Twenty-four patterns based on up-regulation (↑), no change (−), or down-regulation (↓) between stages are identified. Vertical grid lines indicate changes between the proerythroblast and basophilic erythroblast stages. Probe sets that did not change among the first 3 stages (−, −, x) are not shown. (C) Comparison of temporal patterns of “core erythroid” (tissue-restricted genes for which expression is shared in the primitive, fetal liver, and adult BM datasets, see “Methods”), “non–tissue-restricted” probe sets (widely expressed in multiple adult tissues, see “Methods”), and housekeeping/maintenance genes during erythroid maturation.
Figure 4
Figure 4
Functional annotation of the erythroid transcriptomes. (A) Venn diagram indicating lineage restriction of moderate and abundant probe sets. Primitive erythroid probe set expression is exclusive to the primitive erythroid lineage (yellow), adult definitive-restricted probe set expression includes BM erythroid expression as well as probe sets expressed in both the BM and the fetal definitive erythroid lineage (blue). (B) Functional annotation of shared and lineage-restricted probe sets based on DAVID clustering were further grouped to reduce complexity. Bar length indicates the relative number of probe sets within each column associated with a functional category. Bar color indicates whether the functional category contains probe sets present in all (core) erythroid cells as well as probe sets restricted to one or both lineages (red), only probe sets found in all erythroid cells (purple), or probe sets restricted to specific lineages (blue). Although the probe sets constituting primitive erythroid, definitive erythroid, and core erythroid functional categories are nonoverlapping, specific probe sets may be listed in more than one functional category. Lists of probe sets that constitute each functional category are available in supplemental Table 4.
Figure 5
Figure 5
Erythroid lineage-restricted expression patterns of Cited2 and Sox6. (A) Affymetrix intensity indicates erythroid lineage–restricted expression of the transcription factors Cited2 and Sox6. (B) qPCR quantitation of Cited2 and Sox6 expression in primitive basophilic erythroblasts from E10.5 blood and definitive basophilic erythroblasts from adult BM. (C) In situ hybridization reveals Cited2 expression in primitive erythroid cells within the blood islands of the E9.5 yolk sac (left) and Sox6 exon 1E expression in the E15.5 fetal liver.
Figure 6
Figure 6
Differential expression of aquaporin gene transcripts in primitive and adult definitive erythroid cells. Aqp1, Aqp3, Aqp8, and Aqp9 expression in primitive and BM definitive erythroblasts quantitated by Affymetrix intensity (A) and qPCR (B) relative to 18S RN(A) (C). Primitive erythroblasts (E10.5) have higher baseline levels of ROS compared with adult definitive erythroblasts and circulating RBCs. Exogenous H2O2 causes ROS to accumulate in primitive but not definitive erythroblasts.
Figure 7
Figure 7
ErythronDB Web site. (A) Expression profile for gene query of Aqp8. P indicates proerythroblast; B, basophilic erythroblast; O, polychromatophilic/orthochromatic erythroblasts; and R, reticulocyte. See supplemental Figure 3A for a complete screen shot. (B) Example of a Boolean search strategy to identify differentially expressed transporter molecules. Gene sets expressed at a threshold level in both populations (top left) are functionally restricted based on GO term (bottom left) and then further limited to gene sets that were differentially expressed (right).

References

    1. Bloom W, Fawcett DW. A Textbook of Histology. 10th Ed. Philadelphia, PA: Saunders; 1975.
    1. Copp AJ. Death before birth: clues from gene knockouts and mutations. Trends Genet. 1995;11(3):87–93. - PubMed
    1. Maximow AA. Untersuchungen uber blut und bindegewebe 1. Die fruhesten entwicklungsstadien der blut- und binde- gewebszellan bein saugetierembryo, bis zum anfang der blutbilding unden leber. Arch Mikroskop Anat. 1909;73:444–561.
    1. Palis J, Robertson S, Kennedy M, Wall C, Keller G. Development of erythroid and myeloid progenitors in the yolk sac and embryo proper of the mouse. Development. 1999;126(22):5073–5084. - PubMed
    1. McGrath KE, Koniski AD, Malik J, Palis J. Circulation is established in a stepwise pattern in the mammalian embryo. Blood. 2003;101(5):1669–1676. - PubMed

Publication types

MeSH terms