The impact of body posture and sleep stages on sleep apnea severity in adults
- PMID: 23243399
- PMCID: PMC3501662
- DOI: 10.5664/jcsm.2258
The impact of body posture and sleep stages on sleep apnea severity in adults
Abstract
Study objectives: Determining the presence and severity of obstructive sleep apnea (OSA) is based on apnea and hypopnea event rates per hour of sleep. Making this determination presents a diagnostic challenge, given that summary metrics do not consider certain factors that influence severity, such as body position and the composition of sleep stages.
Methods: We retrospectively analyzed 300 consecutive diagnostic PSGs performed at our center to determine the impact of body position and sleep stage on sleep apnea severity.
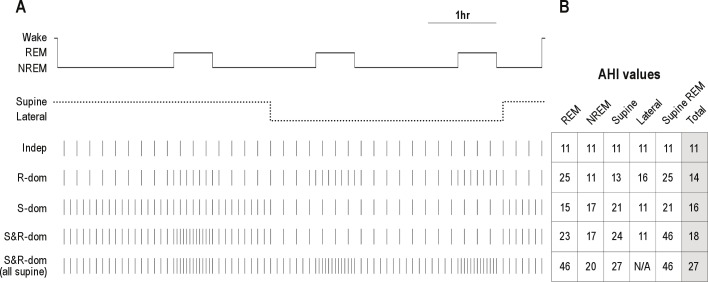
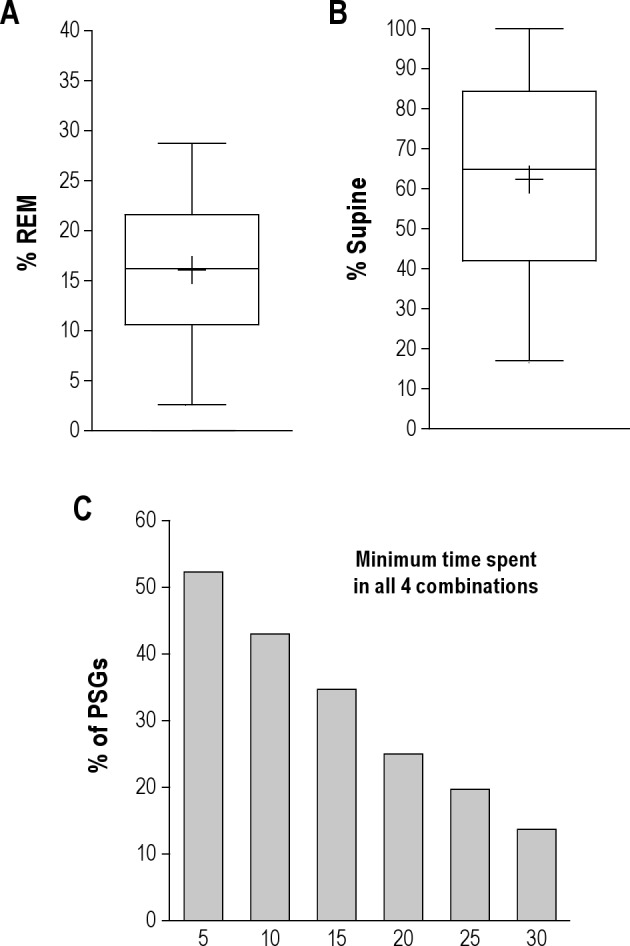
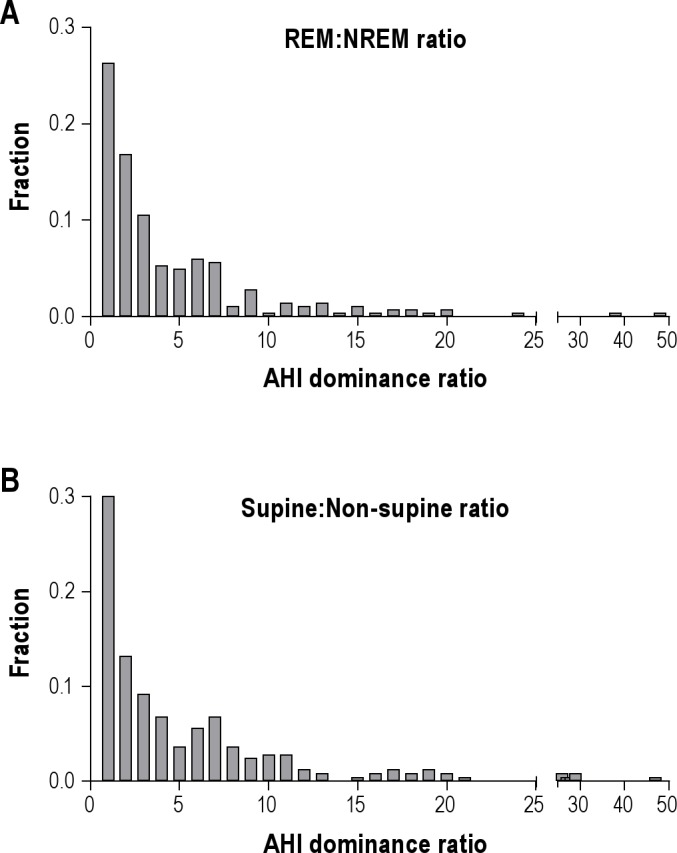
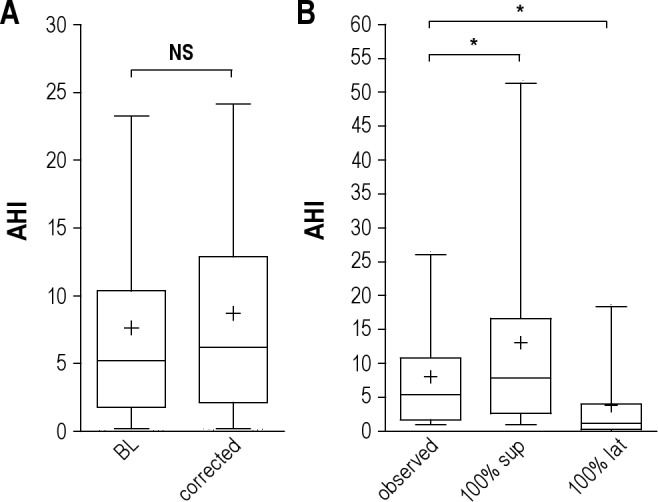
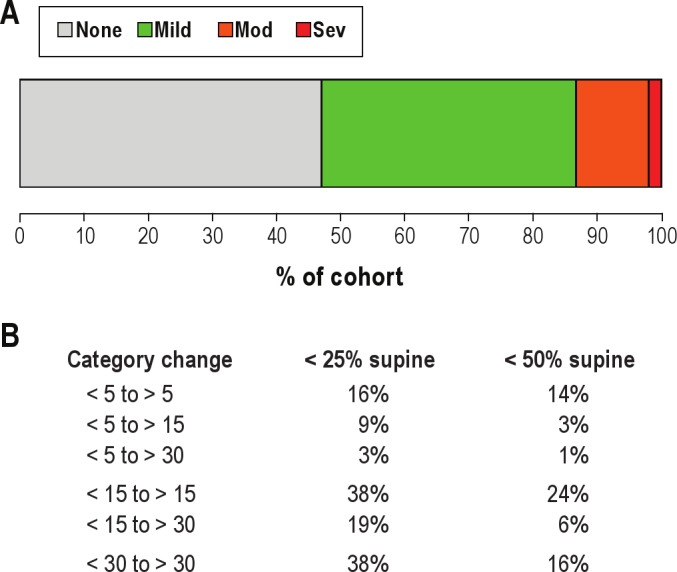
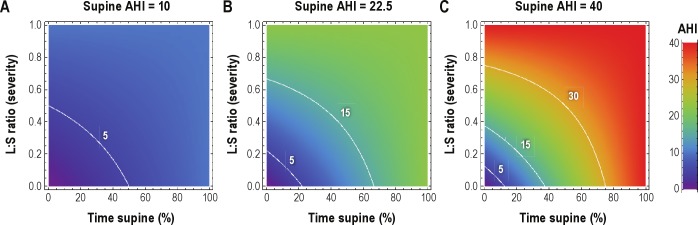
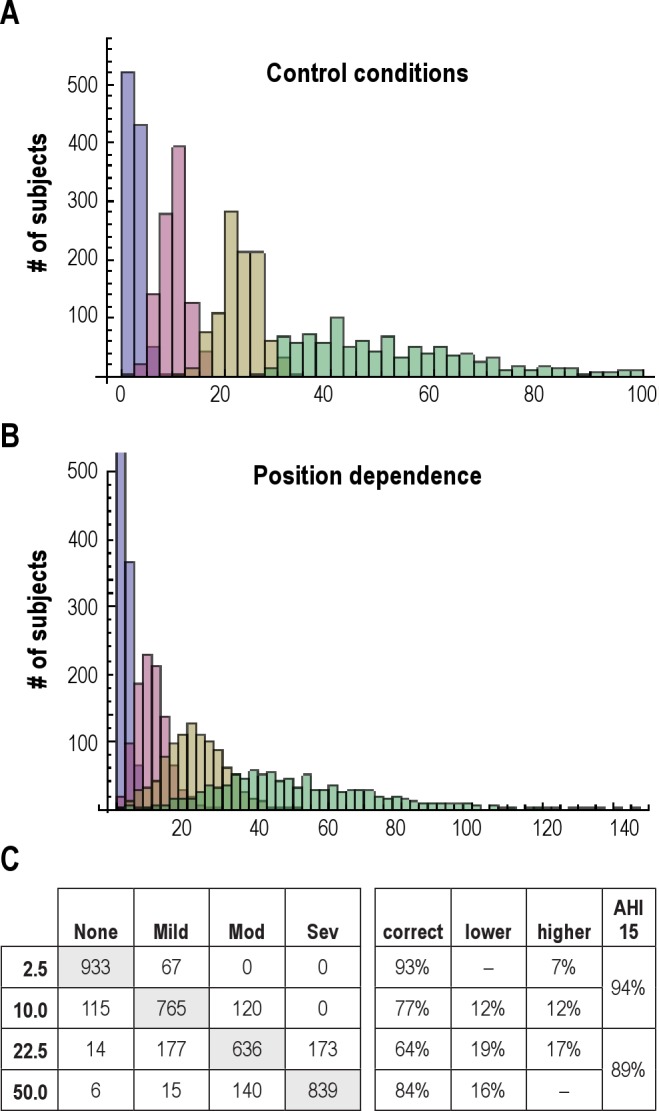
Results: The median percent of REM sleep was 16% (reduced compared to a normal value of ~25%). The median percent supine sleep was 65%. Fewer than half of PSGs contained > 10 min in each of the 4 possible combinations of REM/NREM and supine/non-supine. Half of patients had > 2-fold worsening of the apnea-hypopnea index (AHI) in REM sleep, and 60% had > 2-fold worsening of AHI while supine. Adjusting for body position had greater impact on the AHI than adjusting for reduced REM%. Misclassification--specifically underestimation of OSA severity--is attributed more commonly to body position (20% to 40%) than to sleep stage (~10%).
Conclusions: Supine-dominance and REM-dominance commonly contribute to AHI underestimation in single-night PSGs. Misclassification of OSA severity can be mitigated in a patient-specific manner by appropriate consideration of these variables. The results have implications for the interpretation of single-night measurements in clinical practice, especially with trends toward home testing devices that may not measure body position or sleep stage.
Figures
Similar articles
-
REM-related obstructive sleep apnea: the effect of body position.J Clin Sleep Med. 2010 Aug 15;6(4):343-8. J Clin Sleep Med. 2010. PMID: 20726282 Free PMC article.
-
Are the adverse effects of body position in patients with obstructive sleep apnea dependent on sleep stage?Sleep Breath. 2010 Feb;14(1):13-7. doi: 10.1007/s11325-009-0269-z. Epub 2009 Jun 18. Sleep Breath. 2010. PMID: 19536575
-
Half of patients with obstructive sleep apnea have a higher NREM AHI than REM AHI.Sleep Med. 2006 Apr;7(3):281-5. doi: 10.1016/j.sleep.2005.10.006. Epub 2006 Mar 24. Sleep Med. 2006. PMID: 16564214
-
Duration of respiratory events in obstructive sleep apnea: Factors influencing the duration of respiratory events.Sleep Med Rev. 2023 Apr;68:101729. doi: 10.1016/j.smrv.2022.101729. Epub 2022 Dec 9. Sleep Med Rev. 2023. PMID: 36549231 Review.
-
The undervalued potential of positional therapy in position-dependent snoring and obstructive sleep apnea-a review of the literature.Sleep Breath. 2013 Mar;17(1):39-49. doi: 10.1007/s11325-012-0683-5. Epub 2012 Mar 24. Sleep Breath. 2013. PMID: 22441662 Free PMC article. Review.
Cited by
-
Length of Individual Apnea Events Is Increased by Supine Position and Modulated by Severity of Obstructive Sleep Apnea.Sleep Disord. 2016;2016:9645347. doi: 10.1155/2016/9645347. Epub 2016 Mar 9. Sleep Disord. 2016. PMID: 27051535 Free PMC article.
-
State-dependent and reflex drives to the upper airway: basic physiology with clinical implications.J Appl Physiol (1985). 2014 Feb 1;116(3):325-36. doi: 10.1152/japplphysiol.00531.2013. Epub 2013 Aug 22. J Appl Physiol (1985). 2014. PMID: 23970535 Free PMC article. Review.
-
The effects of body position on the distribution of obstructive, mixed and central sleep apnoea.Afr J Thorac Crit Care Med. 2019 Dec 6;25(4):10.7196/AJTCCM.2019.v25i4.024. doi: 10.7196/AJTCCM.2019.v25i4.024. eCollection 2019. Afr J Thorac Crit Care Med. 2019. PMID: 34286265 Free PMC article.
-
Association between Snoring and Leukocyte Telomere Length.Sleep. 2016 Apr 1;39(4):767-72. doi: 10.5665/sleep.5624. Sleep. 2016. PMID: 26715224 Free PMC article.
-
Serum testosterone/cortisol ratio in people with obstructive sleep apnea.J Clin Lab Anal. 2020 Jan;34(1):e23011. doi: 10.1002/jcla.23011. Epub 2019 Sep 23. J Clin Lab Anal. 2020. PMID: 31549459 Free PMC article.
References
-
- Yaggi HK, Concato J, Kernan WN, Lichtman JH, Brass LM, Mohsenin V. Obstructive sleep apnea as a risk factor for stroke and death. N Engl J Med. 2005;353:2034–41. - PubMed
-
- American Academy of Sleep Medicine. International Classification of sleep disorders: diagnostic and coding manual. 2nd ed. Westchester, IL: American Academy of Sleep Medicine; 2005.
Publication types
MeSH terms
LinkOut - more resources
Full Text Sources
Other Literature Sources
Medical