. 2012:2012:320304.
doi: 10.1155/2012/320304. Epub 2012 Oct 31.

Suppression of diet-induced hypercholesterolemia by turtle jelly, a traditional chinese functional food, in rats

Affiliations

Suppression of diet-induced hypercholesterolemia by turtle jelly, a traditional chinese functional food, in rats

Jian-Hong Wu et al. Evid Based Complement Alternat Med. 2012.

Abstract

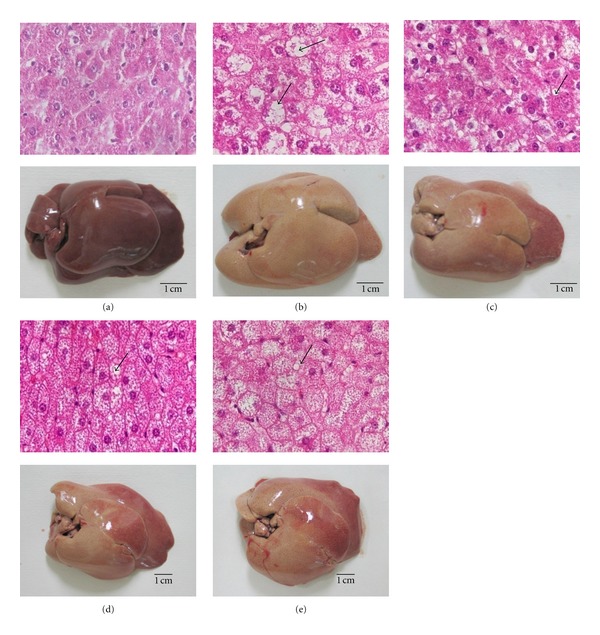
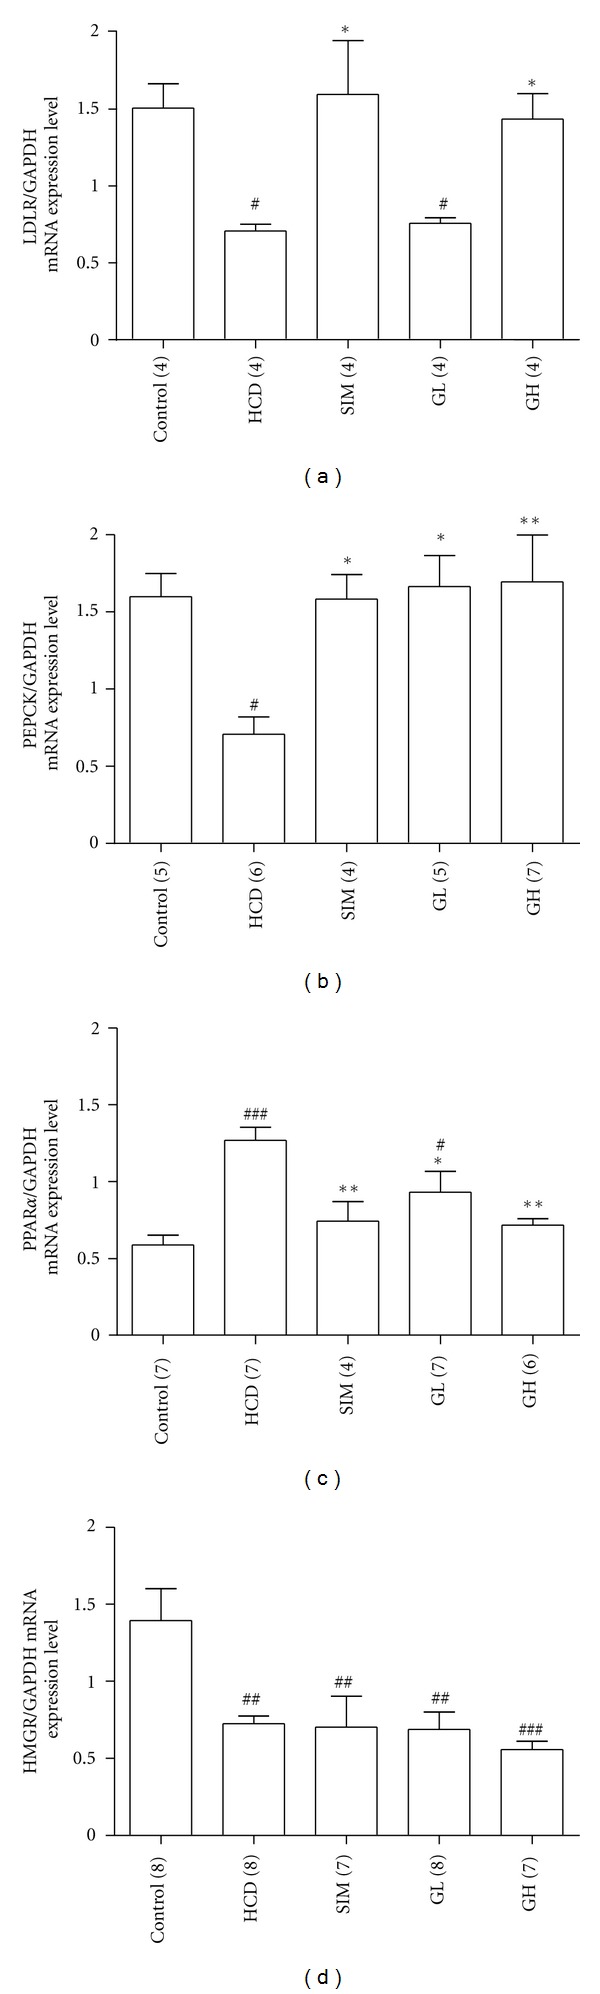
Consumption of functional foods for lowering serum cholesterol has globally gained acceptance by the general public. Turtle jelly (TJ), also called gui-ling-gao, is a popular traditional functional food in southern China. The hypocholesterolemic effect of consuming TJ was investigated in rats fed with normal diet, high-cholesterol diet or high-cholesterol diet supplemented with simvastatin (3 mg/kg bw per day, p.o.) or TJ (3.3 or 10 mL/kg bw per day, p.o.) for 30 days. TJ markedly reversed the increased serum total cholesterol, increased high-density lipoprotein, and decreased high-density lipoprotein induced by hypercholesterolemic diet with a dose-dependent improvement on the atherogenic index. It also demonstrated good hepatoprotective function by reducing fat depositions and overall lipid contents in the liver and increasing the activities of hepatic antioxidative enzymes. The blunted nitric oxide/endothelium-mediated aortic relaxation in rats fed with hypercholesterolemic diet was partially restored after TJ consumption. It is postulated that the hypocholesterolemic effect is the primary beneficial effect given by TJ; it then leads to secondary beneficial effects such as vasoprotective and hepatoprotective functions. The results revealed that TJ could block the downregulation of LDLR and PEPCK and upregulation of PPARα mRNA and protein expressions in the livers of rats fed with hypercholesterolemic diet.


Figures

Figure 1
Figure 1
HPLC/UV (254 nm) chromatogram of the turtle jelly sample used in the current study. (1) caffeoylquinic acid, (2) 5-O-caffeoylshikimic acid, (3) astilbin, (4) 3,4-dicaffeoylquinic acid, (5) 4,5-dicaffeoylquinic acid, (6) neoisoastilbin, (7) isoastilbin, (8) engeletin, and (9) 3,5-dicafeoyylquinic acid.
Figure 2
Figure 2
The atherogenic indexes of animals from the groups of Control, HCD, SIM (3 mg/kg bw per day), GL (3.3 mL/kg bw per day), and GH (10 mL/kg bw per day). Data are expressed as means ± SEM, n = 5–7. ## P < 0.01 and ### P < 0.001 represent significant differences when compared with the Control. *P < 0.05 and **P < 0.01 represent significant differences when compared with the HCD. The number in parentheses is n for individual group.
Figure 3
Figure 3
(a) CAT, (b) SOD, (c) GSH-PX activities, and (d) MDA contents of isolated livers from the Control, HCD, SIM (3 mg/kg bw per day), GL (3.3 mL/kg bw per day), and GH (10 mL/kg bw per day). Data are expressed as means ± SEM, n = 5–8. # P < 0.05, ## P < 0.01, and ### P < 0.001 represent significant differences when compared with the Control. *P < 0.05, **P < 0.01, and ***P < 0.001 represent significant differences when compared with the HCD. The number in parentheses is n for individual group.
Figure 4
Figure 4
Histological examination of the livers obtained from the (a) Control, (b) HCD, (c) SIM (3 mg/kg bw per day), (d) GL (3.3 mL/kg bw per day), and (e) GH (10 mL/kg bw per day). Photographs of the cross-section (400× magnification) of livers (top) and the gross appearance of the entire livers (bottom) are illustrated. Arrows show the location of lipid depositions.
Figure 5
Figure 5
(a) Liver indexes (g of liver per kg bw) for various groups. (b) Total lipid contents (g of lipid per g of liver) isolated from various groups. Data are expressed as means ± SEM, n = 8. ### P < 0.001 represents significant differences when compared with the Control. **P < 0.01 when compared with the HCD group.*P < 0.05 and **P < 0.01 represent significant differences when compared with the HCD. The number in parentheses is n for individual group.
Figure 6
Figure 6
The concentration-response curves to acetylcholine are expressed as decrease in (percentage) steady-state tension obtained with 1 μM phenylephrine precontracted thoracic aortic rings from the Control, HCD, SIM (3 mg/kg bw per day), GL (3.3 mL/kg bw per day), and GH (10 mL/kg bw per day). Data are expressed as means ± SEM, n = 8. # P < 0.05  ## P < 0.01, and ### P < 0.001 represent significant differences when compared with the Control. *P < 0.05 represents significant differences when compared with the HCD. The number in parentheses is n for individual group.
Figure 7
Figure 7
(a) In vitro nitrite productions from various groups' isolated aortas under challenge with acetylcholine (1 μM) and (b) eNOS mRNA expressions in various groups' isolated aortas. The expression level of eNOS was normalized to that of the GAPDH. Data are expressed as means ± SEM, n = 4–6. # P < 0.05 represents significant differences when compared with the Control. *P < 0.05 represents significant differences when compared with the HCD. The number in parentheses is n for individual group.
Figure 8
Figure 8
Real-time RT-PCR analysis of the mRNA expressions of (a) LDLR, (b) PEPCK, (c) PPARα, and (d) HMGR in the livers from the Control, HCD, SIM (3 mg/kg bw per day), GL (3.3 mL/kg bw per day), and GH (10 mL/kg bw per day). The expression level of each gene was normalized to that of the GAPDH gene in each sample. Data are expressed as means ± SEM, n = 4–7. # P < 0.05, ## P < 0.01, and ## P < 0.01 represent significant differences when compared with the Control group. *P < 0.05 and **P < 0.01 represent significant differences when compared with the HCD. The number in parentheses is n for individual group.
Figure 9
Figure 9
Representative Western blots and graphs represent quantitative comparisons of protein expressions of (a) LDLR, (b) PEPCK, (c) PPARα, and (d) HMGR in the livers from the Control, HCD, SIM (3 mg/kg bw per day), GL (3.3 mL/kg bw per day), and GH (10 mL/kg bw per day). The expression level of each protein was normalized to that of the GAPDH protein in each sample. Data are expressed as means ± SEM, n = 4–7. # P < 0.05 represents significant differences when compared with the Control. *P < 0.05 represents significant differences when compared with the HCD. The number in parentheses is n for individual group.

References

    1. Deepa PR, Varalakshmi P. Atheroprotective effect of exogenous heparin-derivative treatment on the aortic disturbances and lipoprotein oxidation in hypercholesterolemic diet fed rats. Clinica Chimica Acta. 2005;355(1-2):119–130. - PubMed
    1. Gotto AM., Jr. Cholesterol management in theory and practice. Circulation. 1997;96(12):4424–4430. - PubMed
    1. Moncada S, Martin JF, Higgs A. Symposium on regression of atherosclerosis. European Journal of Clinical Investigation. 1993;23(7):385–398. - PubMed
    1. Kwok CY, Wong CNY, Yau MYC, et al. Consumption of dried fruit of Crataegus pinnatifida (hawthorn) suppresses high-cholesterol diet-induced hypercholesterolemia in rats. Journal of Functional Foods. 2010;2(3):179–186.
    1. Rosenson RS. Pluripotential mechanisms of cardioprotection with HMG-CoA reductase inhibitor therapy. American Journal of Cardiovascular Drugs. 2001;1(6):411–420. - PubMed

LinkOut - more resources