Spectral domain optical coherence tomography of multi-MHz A-scan rates at 1310 nm range and real-time 4D-display up to 41 volumes/second
- PMID: 23243560
- PMCID: PMC3521307
- DOI: 10.1364/BOE.3.003067
Spectral domain optical coherence tomography of multi-MHz A-scan rates at 1310 nm range and real-time 4D-display up to 41 volumes/second
Abstract
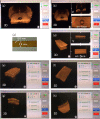
An ultrafast frequency domain optical coherence tomography system was developed at A-scan rates between 2.5 and 10 MHz, a B-scan rate of 4 or 8 kHz, and volume-rates between 12 and 41 volumes/second. In the case of the worst duty ratio of 10%, the averaged A-scan rate was 1 MHz. Two optical demultiplexers at a center wavelength of 1310 nm were used for linear-k spectral dispersion and simultaneous differential signal detection at 320 wavelengths. The depth-range, sensitivity, sensitivity roll-off by 6 dB, and axial resolution were 4 mm, 97 dB, 6 mm, and 23 μm, respectively. Using FPGAs for FFT and a GPU for volume rendering, a real-time 4D display was demonstrated at a rate up to 41 volumes/second for an image size of 256 (axial) × 128 × 128 (lateral) voxels.
Keywords: (100.6890) Three-dimensional image processing; (110.4500) Optical coherence tomography; (170.4500) Optical coherence tomography.
Figures


Similar articles
-
Graphics processing unit accelerated optical coherence tomography processing at megahertz axial scan rate and high resolution video rate volumetric rendering.J Biomed Opt. 2013 Feb;18(2):26002. doi: 10.1117/1.JBO.18.2.026002. J Biomed Opt. 2013. PMID: 23377003
-
Real-time display on Fourier domain optical coherence tomography system using a graphics processing unit.J Biomed Opt. 2009 Nov-Dec;14(6):060506. doi: 10.1117/1.3275463. J Biomed Opt. 2009. PMID: 20059237
-
Real-time 3D and 4D Fourier domain Doppler optical coherence tomography based on dual graphics processing units.Biomed Opt Express. 2012 Sep 1;3(9):2162-74. doi: 10.1364/BOE.3.002162. Epub 2012 Aug 20. Biomed Opt Express. 2012. PMID: 23024910 Free PMC article.
-
4D optical coherence tomography-based micro-angiography achieved by 1.6-MHz FDML swept source.Opt Lett. 2015 Apr 15;40(8):1779-82. doi: 10.1364/OL.40.001779. Opt Lett. 2015. PMID: 25872072 Free PMC article.
-
Simultaneous dual-band optical coherence tomography in the spectral domain for high resolution in vivo imaging.Opt Express. 2009 Oct 26;17(22):19486-500. doi: 10.1364/OE.17.019486. Opt Express. 2009. PMID: 19997169
Cited by
-
Characterization of early-stage cutaneous radiation injury by using optical coherence tomography angiography.Biomed Opt Express. 2020 Apr 20;11(5):2652-2664. doi: 10.1364/BOE.387400. eCollection 2020 May 1. Biomed Opt Express. 2020. PMID: 32499950 Free PMC article.
-
Scalable multiplexing for parallel imaging with interleaved optical coherence tomography.Biomed Opt Express. 2014 Aug 27;5(9):3192-203. doi: 10.1364/BOE.5.003192. eCollection 2014 Sep 1. Biomed Opt Express. 2014. PMID: 25401031 Free PMC article.
-
Real-time corneal segmentation and 3D needle tracking in intrasurgical OCT.Biomed Opt Express. 2018 May 21;9(6):2716-2732. doi: 10.1364/BOE.9.002716. eCollection 2018 Jun 1. Biomed Opt Express. 2018. PMID: 30258685 Free PMC article.
-
Microscope-Integrated Intraoperative Ultrahigh-Speed Swept-Source Optical Coherence Tomography for Widefield Retinal and Anterior Segment Imaging.Ophthalmic Surg Lasers Imaging Retina. 2018 Feb 1;49(2):94-102. doi: 10.3928/23258160-20180129-03. Ophthalmic Surg Lasers Imaging Retina. 2018. PMID: 29443358 Free PMC article.
-
High definition live 3D-OCT in vivo: design and evaluation of a 4D OCT engine with 1 GVoxel/s.Biomed Opt Express. 2014 Aug 6;5(9):2963-77. doi: 10.1364/BOE.5.002963. eCollection 2014 Sep 1. Biomed Opt Express. 2014. PMID: 25401010 Free PMC article.
References
-
- Vakoc B. J., Shishko M., Yun S. H., Oh W. Y., Suter M. J., Desjardins A. E., Evans J. A., Nishioka N. S., Tearney G. J., Bouma B. E., “Comprehensive esophageal microscopy by using optical frequency-domain imaging (with video),” Gastrointest. Endosc. 65(6), 898–905 (2007).10.1016/j.gie.2006.08.009 - DOI - PMC - PubMed
LinkOut - more resources
Full Text Sources
Other Literature Sources
Miscellaneous
