. 2012 Dec 1;3(12):3127-37.
doi: 10.1364/BOE.3.003127. Epub 2012 Nov 7.

Quantitative OCT angiography of optic nerve head blood flow

Affiliations

Quantitative OCT angiography of optic nerve head blood flow

Yali Jia et al. Biomed Opt Express. .

Abstract

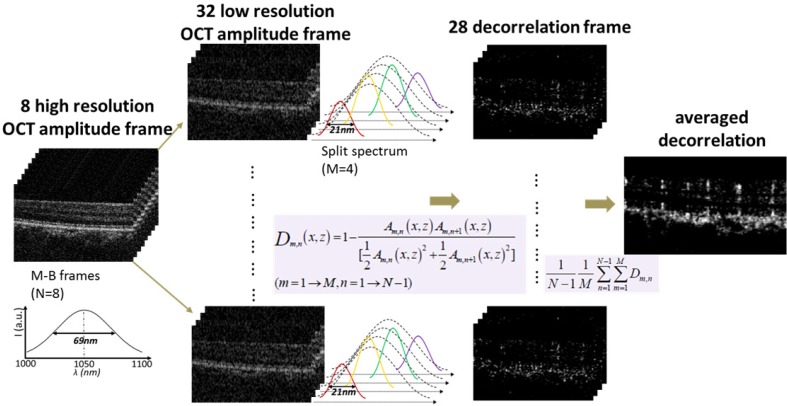
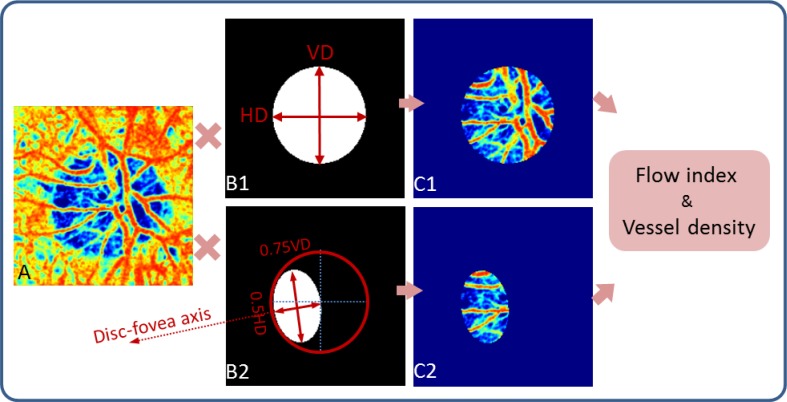
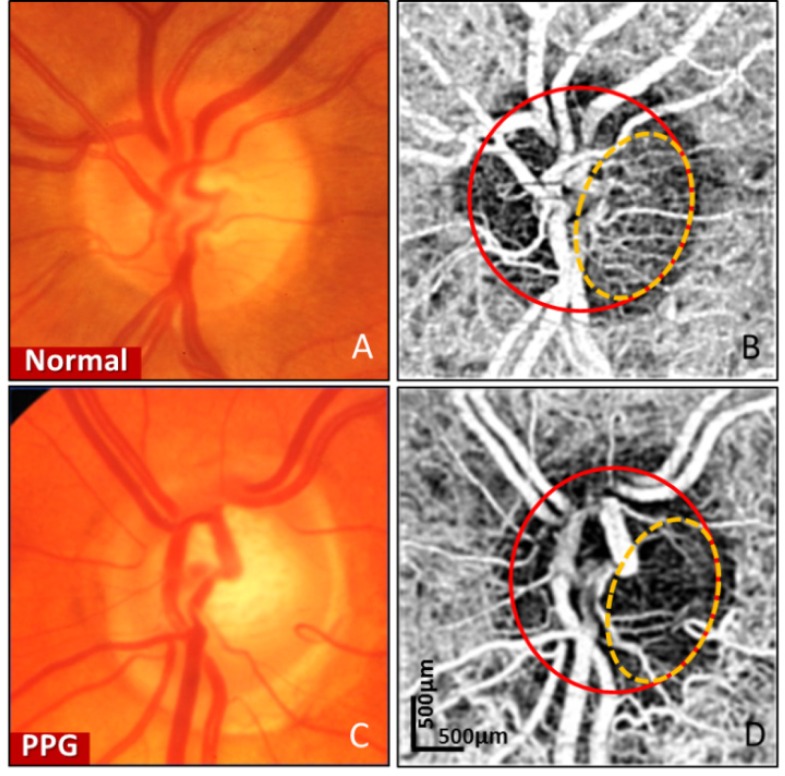
Optic nerve head (ONH) blood flow may be associated with glaucoma development. A reliable method to quantify ONH blood flow could provide insight into the vascular component of glaucoma pathophysiology. Using ultrahigh-speed optical coherence tomography (OCT), we developed a new 3D angiography algorithm called split-spectrum amplitude-decorrelation angiography (SSADA) for imaging ONH microcirculation. In this study, a method to quantify SSADA results was developed and used to detect ONH perfusion changes in early glaucoma. En face maximum projection was used to obtain 2D disc angiograms, from which the average decorrelation values (flow index) and the percentage area occupied by vessels (vessel density) were computed from the optic disc and a selected region within it. Preperimetric glaucoma patients had significant reductions of ONH perfusion compared to normals. This pilot study indicates OCT angiography can detect the abnormalities of ONH perfusion and has the potential to reveal the ONH blood flow mechanism related to glaucoma.

Keywords: (170.3880) Medical and biological imaging; (170.4470) Ophthalmology; (170.4500) Optical coherence tomography.


Figures

Fig. 1
Fig. 1
Flow chart detailing the basic steps of the SSADA algorithm. Eight OCT M-B frames were scanned consecutively at the same spatial location to produce 8 spectral interferograms and 8 standard-resolution cross-sectional images. In conventional decorrelation angiography, decorrelation is calculated between these standard resolution images, but this produces a low-quality angiogram. In SSADA, each full spectral interferogram was split into 4 spectral bands. There were 8 OCT image frames at each spectral band, from which 7 decorrelation frames were calculated. The 28 decorrelation frames were averaged to produce one final decorrelation-based flow cross-section of much higher quality [26].
Fig. 2
Fig. 2
In vivo 3D volumetric [3.0 (x) × 3.0 (y) × 2.9 (z) mm] OCT images of the ONH in the right eye of a normal subject. The images in (E) and (F) were cropped from 2.9 mm to 1.8 mm axially. (A) Rendering of a scanned disc volume reflectance intensity image . (B) 3D rendering of flow image. (C) An en face maximum reflectance intensity projection showed branches of the central retinal vessels. (D) En face maximum decorrelation projection angiogram. (E) OCT cross-section at the plane marked by red dashed line in (C). The boundary of the neural canal opening (NCO), indicated by two green dashed lines, was determined by the termination of the RPE/BM complex, shown by two green arrows that corresponded to the two margin points in (C) & (D). (F) Cross-sectional gray scale reflectance intensity image overlaid by the color scale flow (decorrelation) image shows that the abundant ONH circulation resides mainly in the lamina cribosa region. The ONH blood flow was obviously lower than that of the major retinal vessels and choroidal vessels, but it was clearly shown in the maximum projection map (see the temporal section of (D)).
Fig. 3
Fig. 3
Flow chart displaying extraction of the flow regions for quantification. (A) The en face maximum decorrelation projection angiogram. The color scale (decorrelation) was related to the localized blood flow magnitude. (B1) The whole disc mask with known value of VD and HD, created by the method described in section 2.4.2. (B2) The temporal elliptical area, derived from the primary whole disc ellipse. The arrow indicates the tilted angle based on the disc-fovea axis. (C1) and (C2) Final segmented flow maps, achieved by multiplying the original disc flow map (A) with two different disc masks (B1 and B2). Further processing could be applied for quantification.
Fig. 4
Fig. 4
Relationship between reflectance intensity and decorrelation used for quality control of 3D decorrelation values. The median values of log intensity and median values of decorrelation were acquired through two 3D outputs (reflectance intensity/decorrelation). All of the values were collected from 4 normal subjects (16 scans). This plot indicates 4.1 (log intensity) can be considered as the cutoff point to remove the scans with lower intensity values that would bias the resulting decorrelation/flow values.
Fig. 5
Fig. 5
Disc photographs (A, C) and en face OCT angiograms (B, D) of the ONH in representative normal (A, B) and preperimetric glaucoma (PPG) subjects (C, D). Both examples are from left eyes. In (B) and (D) the solid circles indicate the whole discs, and the dash circles indicate the temporal ellipses. A dense microvascular network was visible on the OCT angiography of the normal disc (B). This network was greatly attenuated in the glaucomatous disc (D).

Similar articles

Cited by

References

    1. Quigley H. A., Vitale S., “Models of open-angle glaucoma prevalence and incidence in the United States,” Invest. Ophthalmol. Vis. Sci. 38(1), 83–91 (1997). - PubMed
    1. Hyman L., Wu S. Y., Connell A. M., Schachat A., Nemesure B., Hennis A., Leske M. C., “Prevalence and causes of visual impairment in The Barbados Eye Study,” Ophthalmology 108(10), 1751–1756 (2001).10.1016/S0161-6420(01)00590-5 - DOI - PubMed
    1. Petrig B. L., Riva C. E., Hayreh S. S., “Laser Doppler flowmetry and optic nerve head blood flow,” Am. J. Ophthalmol. 127(4), 413–425 (1999).10.1016/S0002-9394(98)00437-1 - DOI - PubMed
    1. Hayreh S. S., “Blood supply of the optic nerve head and its role in optic atrophy, glaucoma, and oedema of the optic disc,” Br. J. Ophthalmol. 53(11), 721–748 (1969).10.1136/bjo.53.11.721 - DOI - PMC - PubMed
    1. Hayreh S. S., “Progress in the understanding of the vascular etiology of glaucoma,” Curr. Opin. Ophthalmol. 5(2), 26–35 (1994).10.1097/00055735-199404000-00006 - DOI

LinkOut - more resources