. 2012 Dec 17:9:108.
doi: 10.1186/1742-4690-9-108.

High-resolution deep sequencing reveals biodiversity, population structure, and persistence of HIV-1 quasispecies within host ecosystems

Affiliations

High-resolution deep sequencing reveals biodiversity, population structure, and persistence of HIV-1 quasispecies within host ecosystems

Li Yin et al. Retrovirology. .

Abstract

Background: Deep sequencing provides the basis for analysis of biodiversity of taxonomically similar organisms in an environment. While extensively applied to microbiome studies, population genetics studies of viruses are limited. To define the scope of HIV-1 population biodiversity within infected individuals, a suite of phylogenetic and population genetic algorithms was applied to HIV-1 envelope hypervariable domain 3 (Env V3) within peripheral blood mononuclear cells from a group of perinatally HIV-1 subtype B infected, therapy-naïve children.

Results: Biodiversity of HIV-1 Env V3 quasispecies ranged from about 70 to 270 unique sequence clusters across individuals. Viral population structure was organized into a limited number of clusters that included the dominant variants combined with multiple clusters of low frequency variants. Next generation viral quasispecies evolved from low frequency variants at earlier time points through multiple non-synonymous changes in lineages within the evolutionary landscape. Minor V3 variants detected as long as four years after infection co-localized in phylogenetic reconstructions with early transmitting viruses or with subsequent plasma virus circulating two years later.

Conclusions: Deep sequencing defines HIV-1 population complexity and structure, reveals the ebb and flow of dominant and rare viral variants in the host ecosystem, and identifies an evolutionary record of low-frequency cell-associated viral V3 variants that persist for years. Bioinformatics pipeline developed for HIV-1 can be applied for biodiversity studies of virome populations in human, animal, or plant ecosystems.


Figures
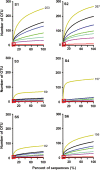
Figure 1
Figure 1
Biodiversity among viral populations. Pyrosequencing data sets from each individual were clustered at 0% (unique) to 10% genetic distances and displayed as rarefaction curves. Y-axis, number of OTU (number of sequence clusters); x-axis, percent of total pyrosequences (sequences sampled ÷ total number of sequences x 100%). Colors of curves indicate the level of clustering: yellow, 0%; black, 1%; blue, 2%; green, 3%; cyan, 4%; purple, 5%; red, 10%. Numbers of OTU at the end of curves at 0% distance represent biodiversity calculated from rarefaction curve at the sequence depth (100% of pyrosequences). Small red boxes indicate approximate sequence depth achieved by conventional clonal sequences.
Figure 2
Figure 2
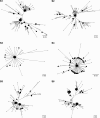
Organization of viral populations. Unrooted neighbor-joining trees were developed for each pyrosequencing data set clustered at 3% pairwise distance. Symbols represent the proportion of total pyrosequences in a cluster: empty circle, ≤ 0.25%; black inverted triangle, > 0.25% to 1%; black square, > 1% to 10%; star, > 10%.
Figure 3
Figure 3
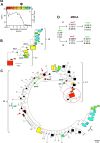
Persistence of V3 variants in PBMC for S1.A. Time line with rainbow colors indicate timing of samples (black dots for clonal sequences; black dot with P for pyrosequences), as well as CD4% (black line) and log10 plasma viral levels (orange line), relative to age/length of infection in years. B. ML tree of longitudinal clonal V3 sequences resembled the topology of trees developed from Env V1 through V3 clonal sequences (sequence number: red – 19, yellow – 37, green – 7, blue - 13). Symbols: ovals, plasma RNA sequences; rectangles, cell-associated DNA sequences. Size of symbols represents relative abundance of sequences in the population. Colors represent time line of samples. Asterisks on a branch represent significant approximate likelihood-ratio test (* > 0.75, ** >0.90). Scale indicates 0.02 nucleotide substitutions per site. C. ML tree combining longitudinal conventional and single-time point deep sequences. Black symbols represent pyrosequences clustered at 3% pairwise distance with symbol shapes indicating proportion of sequences in each cluster: empty circle ≤ 0.25%; black inverted triangle, > 0.25% to 1%; black square, > 1% to 10%; star, > 10%. Brackets indicate colocalization of cell-associated viral variants by pyrosequencing with: “a”, clonal RNA and DNA viral sequences from earlier time point; or “b”, clonal plasma viral variants from later time points. Scale indicates 0.02 nucleotide substitutions per site.
Figure 4
Figure 4
Persistence of V3 variants and evolutionary intermediates.A. Time line with rainbow colors indicates timing of samples (black dots, clonal sequences; P, pyrosequences), CD4% (black line) and log10 plasma viral load at one time point (an orange dot), relative to age/length of infection in years. B. ML tree of conventional sequences (sequence number: red – 10, yellow – 15, green – 8, blue - 17) with most recent common ancestral nodes (anc) labeled for different lineages (green circles). Scale: 0.02 nucleotide substitutions/site. Symbols: ovals, plasma RNA sequences; rectangles, cell-associated DNA sequences. Size of symbols: relative abundance of sequences in the population. Colors: timing of samples. Asterisks on branches: significant approximate likelihood-ratio test (* >0.75, ** >0.90). C. ML tree combining longitudinal conventional and single-time point pyrosequences with anc nodes marked for different lineages (green circles: the same anc nodes as in panel B; red circles: additional anc nodes when pyrosequences filled in the phylogenetic landscape). Black symbols: represent pyrosequences clustered at 3% distance with symbol shapes indicating proportion of sequences in each cluster: empty circle ≤ 0.25%; black inverted triangle, > 0.25% to 1%; black square, > 1% to 10%; star, > 10%. Brackets with “b”: clustering of cell associated viral variants by pyrosequencing with clonal plasma viral variants from a later time point. Red circle: colocalization of cell-associated virus from near birth with a subset of pyrosequences in cells 4.5 years later. D. Most recent common ancestors (MRCA) on ML tree of panel C. Anc1, anc2 and anc3: the same ancestral nodes on ML tree in panel B. Anc2’ and anc3’: additional ancestral nodes when pyrosequences fill in the evolutionary landscape. Numbers: amino acid positions relative to HIV-1HXB2 gp160 [36]. NOTE. MRCA analysis was not performed on S1 data because only single amino acid changes occurred between ancestral nodes on the conventional ML tree.

References

    1. Garcia-Arriaza J, Domingo E, Briones C. Characterization of minority subpopulations in the mutant spectrum of HIV-1 quasispecies by successive specific amplifications. Virus Res. 2007;129(2):123–134. doi: 10.1016/j.virusres.2007.07.001. - DOI - PubMed
    1. Paredes R, Clotet B. Clinical management of HIV-1 resistance. Antiviral Res. 2010;85(1):245–265. doi: 10.1016/j.antiviral.2009.09.015. - DOI - PubMed
    1. Boutwell CL, Rolland MM, Herbeck JT, Mullins JI, Allen TM. Viral evolution and escape during acute HIV-1 infection. J Infect Dis. 2010;202(Suppl 2):S309–314. - PMC - PubMed
    1. Goodenow M, Huet T, Saurin W, Kwok S, Sninsky J, Wain-Hobson S. HIV-1 isolates are rapidly evolving quasispecies: evidence for viral mixtures and preferred nucleotide substitutions. J Acquir Immune Defic Syndr. 1989;2(4):344–352. - PubMed
    1. Lamers SL, Sleasman JW, She JX, Barrie KA, Pomeroy SM, Barrett DJ, Goodenow MM. Independent variation and positive selection in env V1 and V2 domains within maternal-infant strains of human immunodeficiency virus type 1 in vivo. J Virol. 1993;67(7):3951–3960. - PMC - PubMed

Publication types

Substances

LinkOut - more resources