

Circumstantial evidence for an increase in the total number and activity of Borrelia-infected Ixodes ricinus in the Netherlands
- PMID: 23244453
- PMCID: PMC3562265
- DOI: 10.1186/1756-3305-5-294
Circumstantial evidence for an increase in the total number and activity of Borrelia-infected Ixodes ricinus in the Netherlands
Abstract
Background: Between 1994 and 2009, a threefold increase has been observed in consultations of general practitioners for tick bites and Lyme disease in The Netherlands. The objective of this study was to determine whether an increase in the number of questing ticks infected with B. burgdorferi sensu lato is a potential cause of the rise in Lyme disease incidence.
Methods: Historic data on land usage, temperature and wildlife populations were collected and analyzed together with data from two longitudinal field studies on density of questing ticks. Effective population sizes of Borrelia burgdorferi s.l. were calculated.
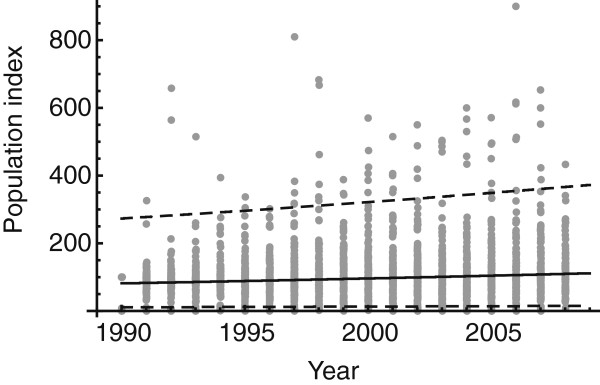
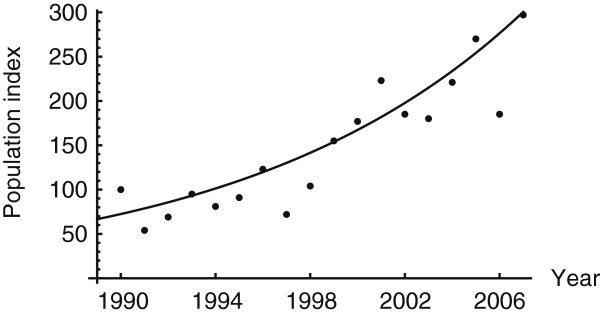
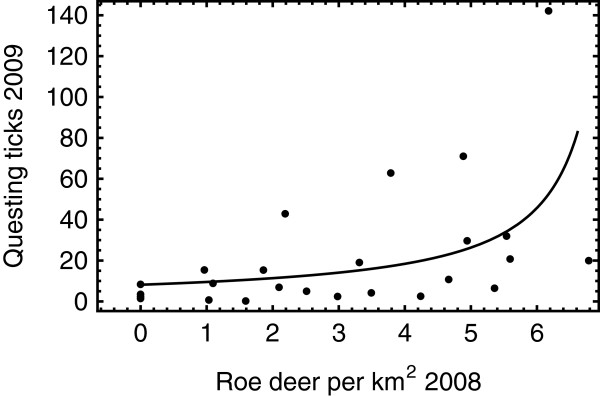
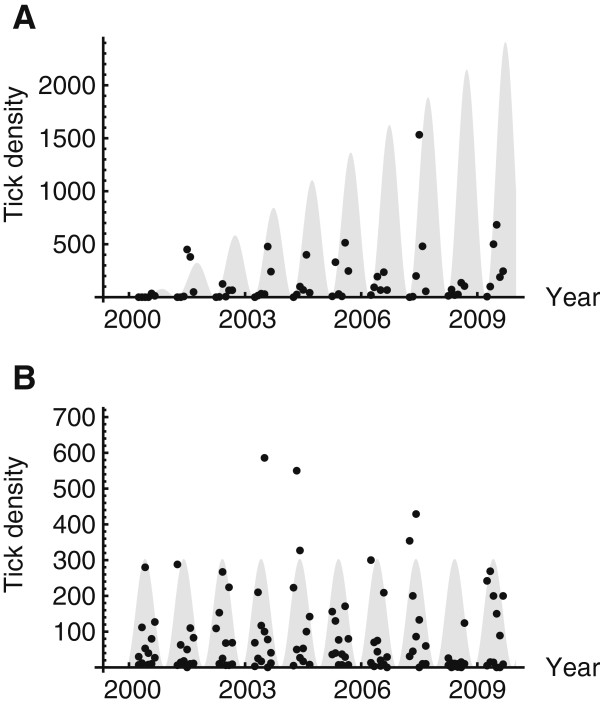
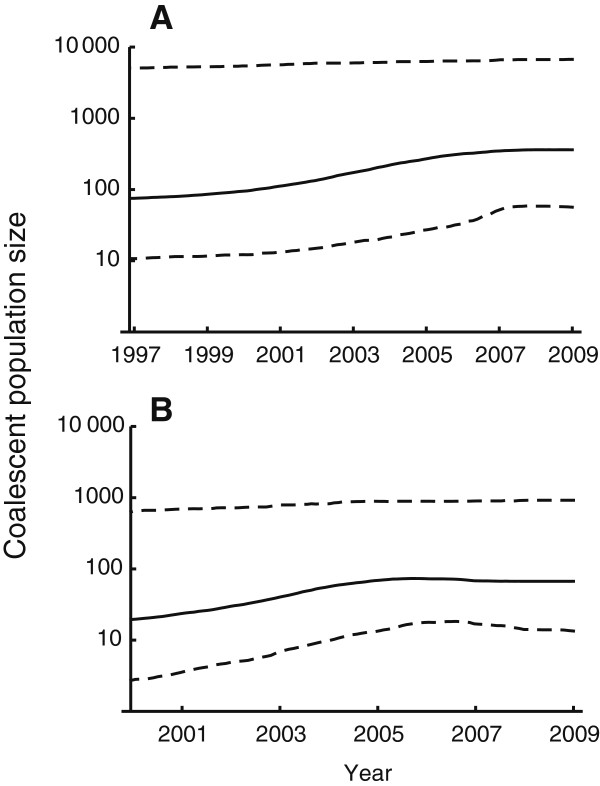
Results: Long-term trend analyses indicated that the length of the annual tick questing season increased as well as the surface area of tick-suitable habitats in The Netherlands. The overall abundances of feeding and reproductive hosts also increased. Mathematical analysis of the data from the field studies demonstrated an increase in mean densities/activities of questing ticks, particularly of larvae between 2006 and 2009. No increase in infection rate of ticks with Borrelia burgdorferi sensu lato was found. Population genetic analysis of the collected Borrelia species points to an increase in B. afzelii and B. garinii populations.
Conclusions: Together, these findings indicate an increase in the total number of Borrelia-infected ticks, providing circumstantial evidence for an increase in the risk of acquiring a bite of a tick infected with B. burgdorferi s.l. Due to the high spatiotemporal variation of tick densities/activities, long-term longitudinal studies on population dynamics of I. ricinus are necessary to observe significant trends.
Figures
References
-
- Stanek G, Fingerle V, Hunfeld KP, Jaulhac B, Kaiser R, Krause A, Kristoferitsch W, O'Connell S, Ornstein K, Strle F. et al.Lyme borreliosis: clinical case definitions for diagnosis and management in Europe. Clin Microbiol Infect. 2012;17(1):69–79. - PubMed
-
- Hubalek Z. Epidemiology of lyme borreliosis. Curr Probl Dermatol. 2009;37:31–50. - PubMed
-
- Hofhuis A, van der Giessen JW, Borgsteede FH, Wielinga PR, Notermans DW, van Pelt W. Lyme borreliosis in the Netherlands: strong increase in GP consultations and hospital admissions in past 10 years. Euro Surveill. 2006;11(6):E060622. 060622. - PubMed
-
- Hofhuis A, Harms MG, Van der Giessen JWB, Sprong H, Notermans DW, Van Pelt W. Ziekte van Lyme in Nederland 1994–2009: aantal huisartsconsulten blijft toenemen. Is voorlichting en curatief beleid genoeg? Infectieziekten, Bulletin. 2010;3(21):84–87.
Publication types
MeSH terms
LinkOut - more resources
Full Text Sources
Medical
