

Evidence-based recommendations for PISA measurements in mitral regurgitation: systematic review, clinical and in-vitro study
- PMID: 23245796
- PMCID: PMC3819991
- DOI: 10.1016/j.ijcard.2012.11.059
Evidence-based recommendations for PISA measurements in mitral regurgitation: systematic review, clinical and in-vitro study
Abstract
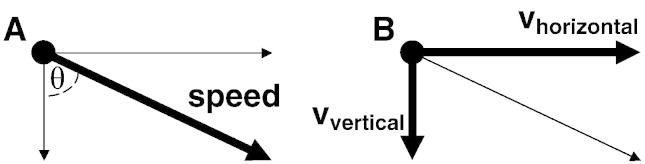
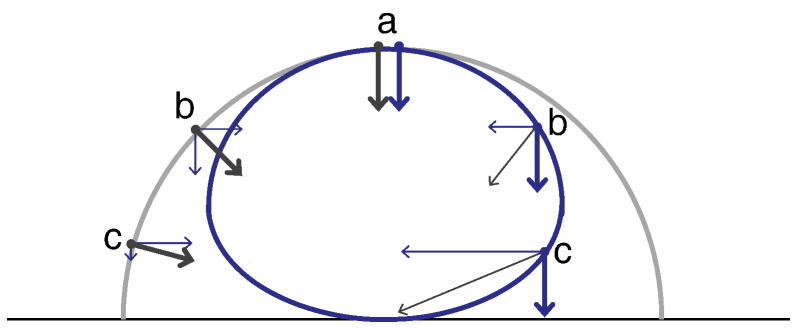
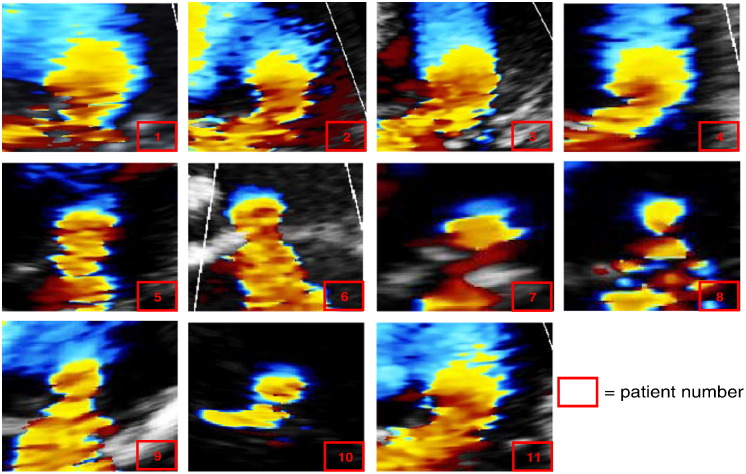
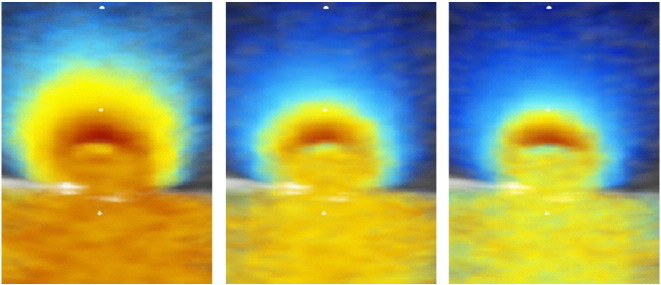
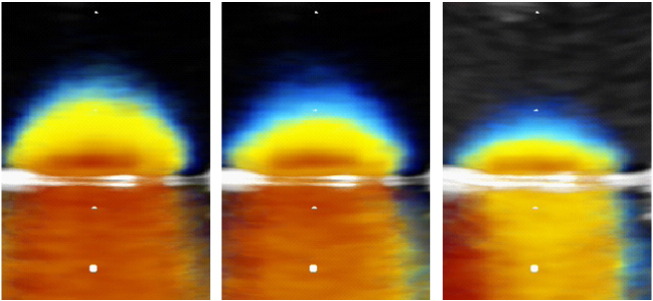
Background: Guidelines for quantifying mitral regurgitation (MR) using "proximal isovelocity surface area" (PISA) instruct operators to measure the PISA radius from valve orifice to Doppler flow convergence "hemisphere". Using clinical data and a physically-constructed MR model we (A) analyse the actually-observed colour Doppler PISA shape and (B) test whether instructions to measure a "hemisphere" are helpful.
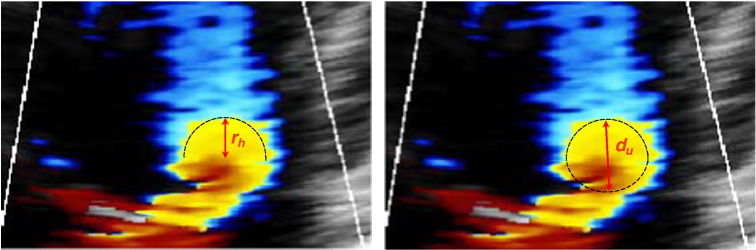
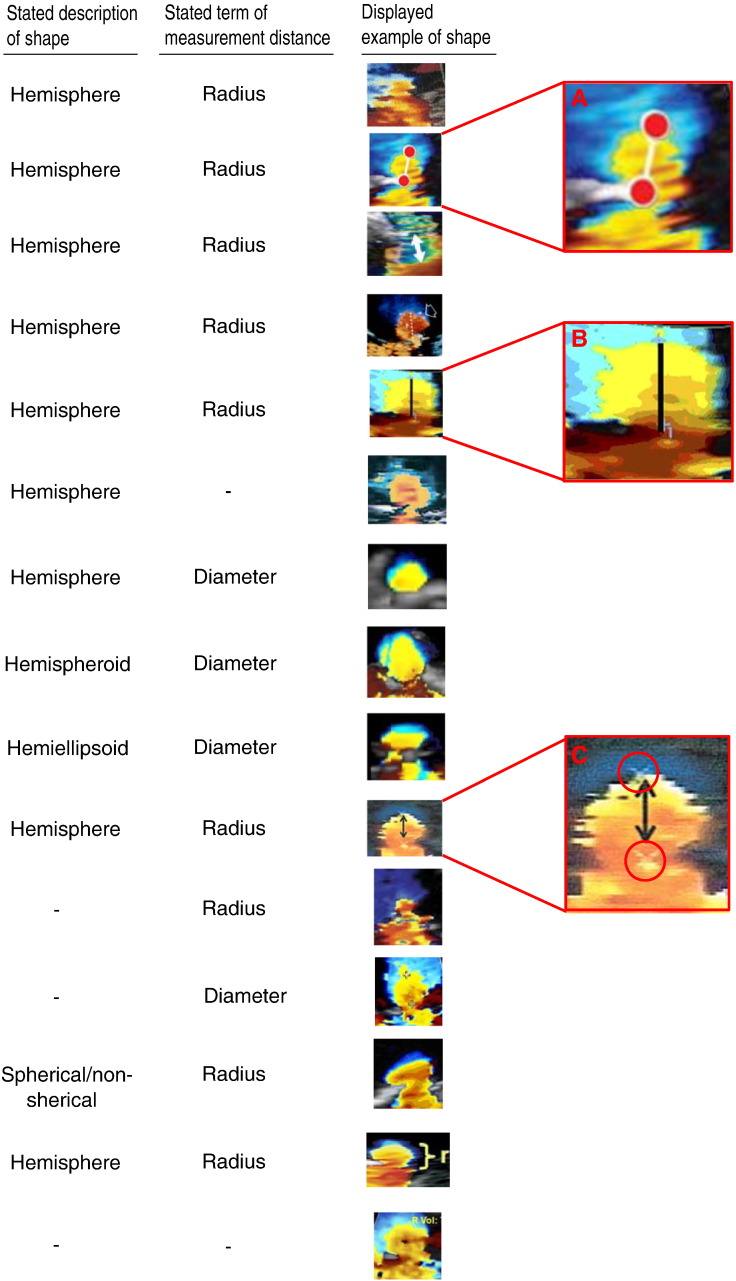
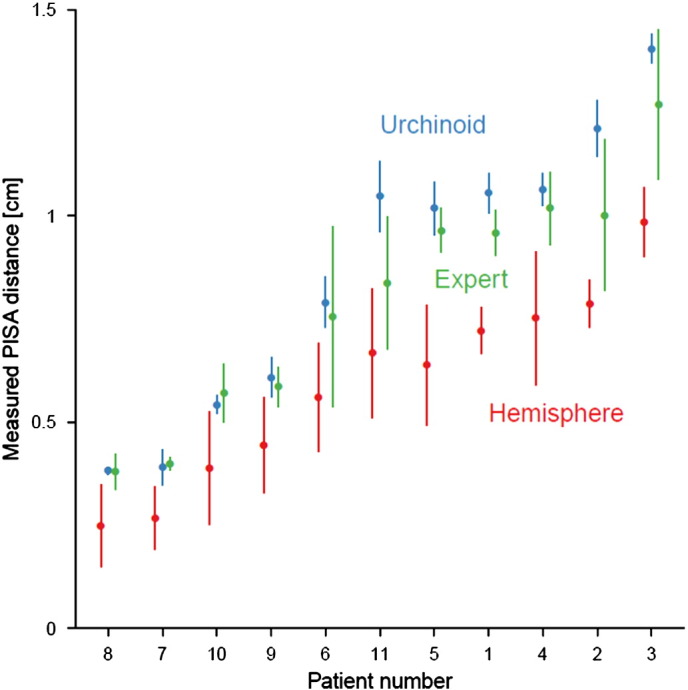
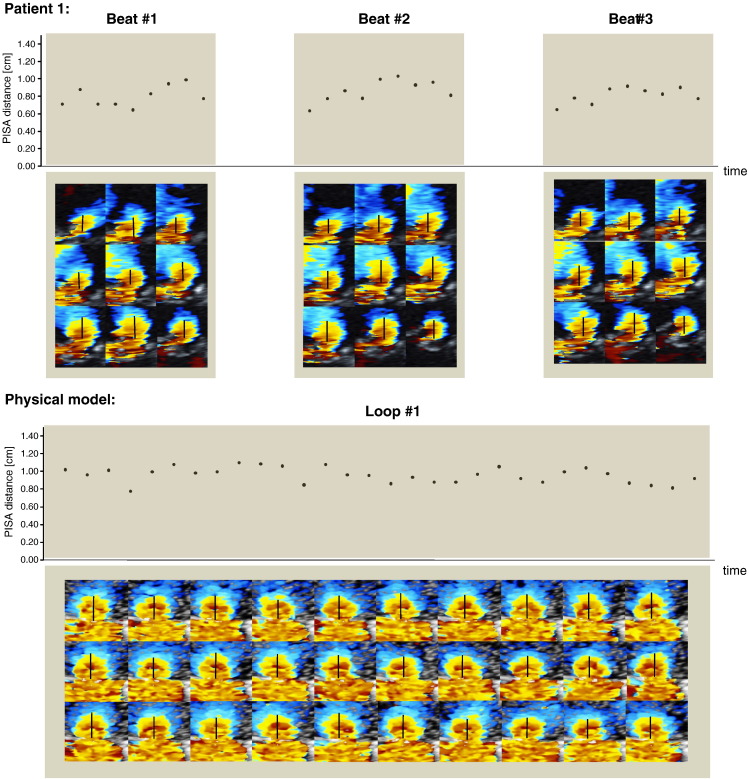
Methods and results: In part A, the true shape of PISA shells was investigated using three separate approaches. First, a systematic review of published examples consistently showed non-hemispherical, "urchinoid" shapes. Second, our clinical data confirmed that the Doppler-visualized surface is non-hemispherical. Third, in-vitro experiments showed that round orifices never produce a colour Doppler hemisphere. In part B, six observers were instructed to measure hemisphere radius rh and (on a second viewing) urchinoid distance (du) in 11 clinical PISA datasets; 6 established experts also measured PISA distance as the gold standard. rh measurements, generated using the hemisphere instruction significantly underestimated expert values (-28%, p<0.0005), meaning r(h)(2) was underestimated by approximately 2-fold. du measurements, generated using the non-hemisphere instruction were less biased (+7%, p=0.03). Finally, frame-to-frame variability in PISA distance was found to have a coefficient of variation (CV) of 25% in patients and 9% in in-vitro data. Beat-to-beat variability had a CV of 15% in patients.
Conclusions: Doppler-visualized PISA shells are not hemispherical: we should avoid advising observers to measure a hemispherical radius because it encourages underestimation of orifice area by approximately two-fold. If precision is needed (e.g. to detect changes reliably) multi-frame averaging is essential.
Keywords: Echocardiography; Mitral regurgitation; PISA method.
Copyright © 2012 Elsevier Ireland Ltd. All rights reserved.
Figures
Similar articles
-
Systemic pharmacological treatments for chronic plaque psoriasis: a network meta-analysis.Cochrane Database Syst Rev. 2021 Apr 19;4(4):CD011535. doi: 10.1002/14651858.CD011535.pub4. Cochrane Database Syst Rev. 2021. Update in: Cochrane Database Syst Rev. 2022 May 23;5:CD011535. doi: 10.1002/14651858.CD011535.pub5. PMID: 33871055 Free PMC article. Updated.
-
Home treatment for mental health problems: a systematic review.Health Technol Assess. 2001;5(15):1-139. doi: 10.3310/hta5150. Health Technol Assess. 2001. PMID: 11532236
-
Cost-effectiveness of using prognostic information to select women with breast cancer for adjuvant systemic therapy.Health Technol Assess. 2006 Sep;10(34):iii-iv, ix-xi, 1-204. doi: 10.3310/hta10340. Health Technol Assess. 2006. PMID: 16959170
-
Systemic pharmacological treatments for chronic plaque psoriasis: a network meta-analysis.Cochrane Database Syst Rev. 2017 Dec 22;12(12):CD011535. doi: 10.1002/14651858.CD011535.pub2. Cochrane Database Syst Rev. 2017. Update in: Cochrane Database Syst Rev. 2020 Jan 9;1:CD011535. doi: 10.1002/14651858.CD011535.pub3. PMID: 29271481 Free PMC article. Updated.
-
Doppler trans-thoracic echocardiography for detection of pulmonary hypertension in adults.Cochrane Database Syst Rev. 2022 May 9;5(5):CD012809. doi: 10.1002/14651858.CD012809.pub2. Cochrane Database Syst Rev. 2022. PMID: 35532166 Free PMC article.
Cited by
-
Isolated Tricuspid Regurgitation: When Is Surgery Appropriate? A State-of-the-Art Narrative Review.J Clin Med. 2025 Jul 17;14(14):5063. doi: 10.3390/jcm14145063. J Clin Med. 2025. PMID: 40725757 Free PMC article. Review.
-
Automatic Segmentation and Assessment of Valvular Regurgitations with Color Doppler Echocardiography Images: A VABC-UNet-Based Framework.Bioengineering (Basel). 2023 Nov 16;10(11):1319. doi: 10.3390/bioengineering10111319. Bioengineering (Basel). 2023. PMID: 38002443 Free PMC article.
-
Analysis of mitral valve regurgitation by computational fluid dynamics.APL Bioeng. 2019 Aug 23;3(3):036105. doi: 10.1063/1.5097245. eCollection 2019 Sep. APL Bioeng. 2019. PMID: 31893254 Free PMC article.
-
Quantification of primary mitral regurgitation by echocardiography: A practical appraisal.Front Cardiovasc Med. 2023 Mar 10;10:1107724. doi: 10.3389/fcvm.2023.1107724. eCollection 2023. Front Cardiovasc Med. 2023. PMID: 36970355 Free PMC article. Review.
-
Comparative quantification of primary mitral regurgitation by computer modeling and simulated echocardiography.Am J Physiol Heart Circ Physiol. 2020 Mar 1;318(3):H547-H557. doi: 10.1152/ajpheart.00367.2019. Epub 2020 Jan 10. Am J Physiol Heart Circ Physiol. 2020. PMID: 31922890 Free PMC article.
References
-
- Lancellotti P., Moura L., Pierard L.A. European Association of Echocardiography recommendations for the assessment of valvular regurgitation. Part 2: mitral and tricuspid regurgitation (native valve disease) Eur J Echocardiogr. 2010;11:307–332. - PubMed
-
- Francis D.P., Willson K., Ceri Davies L., Florea V.G., Coats A.J.S., Gibson D.G. True shape and area of proximal isovelocity surface area (PISA) when flow convergence is hemispherical in valvular regurgitation. Int J Cardiol. 2000;73:237–242. - PubMed
-
- Matsumura Y., Fukuda S., Tran H. Geometry of the proximal isovelocity surface area in mitral regurgitation by 3-dimensional color Doppler echocardiography: difference between functional mitral regurgitation and prolapse regurgitation. Am Heart J. 2008;155:231–238. - PubMed
-
- Moraldo M., Del Franco A., Pugliese N.R., Pabari P.A., Francis D.P. Avoiding bias in measuring “hemisphere radius” in echocardiographic mitral regurgitation quantification: Mona Lisa PISA. Int J Cardiol. 2012;155(2):318–320. - PubMed
-
- Rifkin R.D., Sharma S. An alternative isovelocity surface model for quantitation of effective regurgitant orifice area in mitral regurgitation with an elongated orifice application to functional mitral regurgitation. JACC Cardiovasc Imaging. 2010;3:1091–1103. - PubMed
Publication types
MeSH terms
Grants and funding
- PP PG/08/114/BHF_/British Heart Foundation/United Kingdom
- FS/10/38/28268/BHF_/British Heart Foundation/United Kingdom
- DPF S/10/038/28268/BHF_/British Heart Foundation/United Kingdom
- MM PG/08/115/BHF_/British Heart Foundation/United Kingdom
- PG/08/115/25781/BHF_/British Heart Foundation/United Kingdom
LinkOut - more resources
Full Text Sources
Other Literature Sources
