Clinical Trial
. 2012 Dec 27;2(6):1554-62.
doi: 10.1016/j.celrep.2012.11.017. Epub 2012 Dec 13.

Mutations in the β-tubulin gene TUBB5 cause microcephaly with structural brain abnormalities

Affiliations
Clinical Trial

Mutations in the β-tubulin gene TUBB5 cause microcephaly with structural brain abnormalities

Martin Breuss et al. Cell Rep. .

Abstract

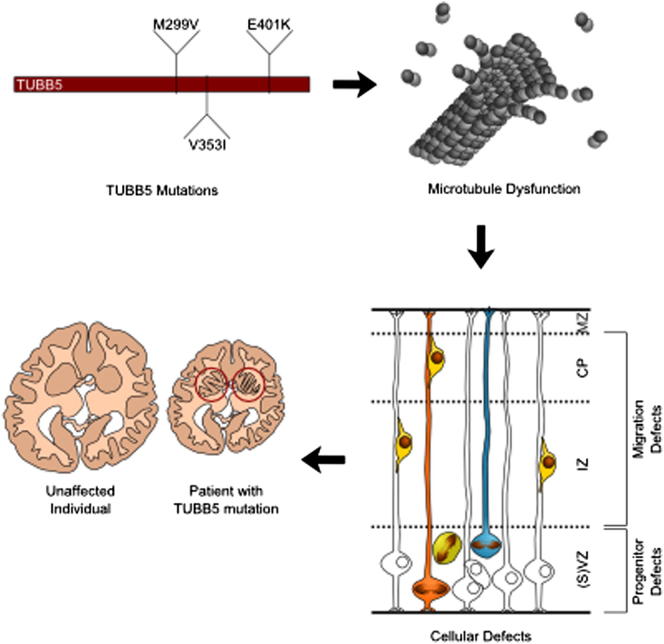
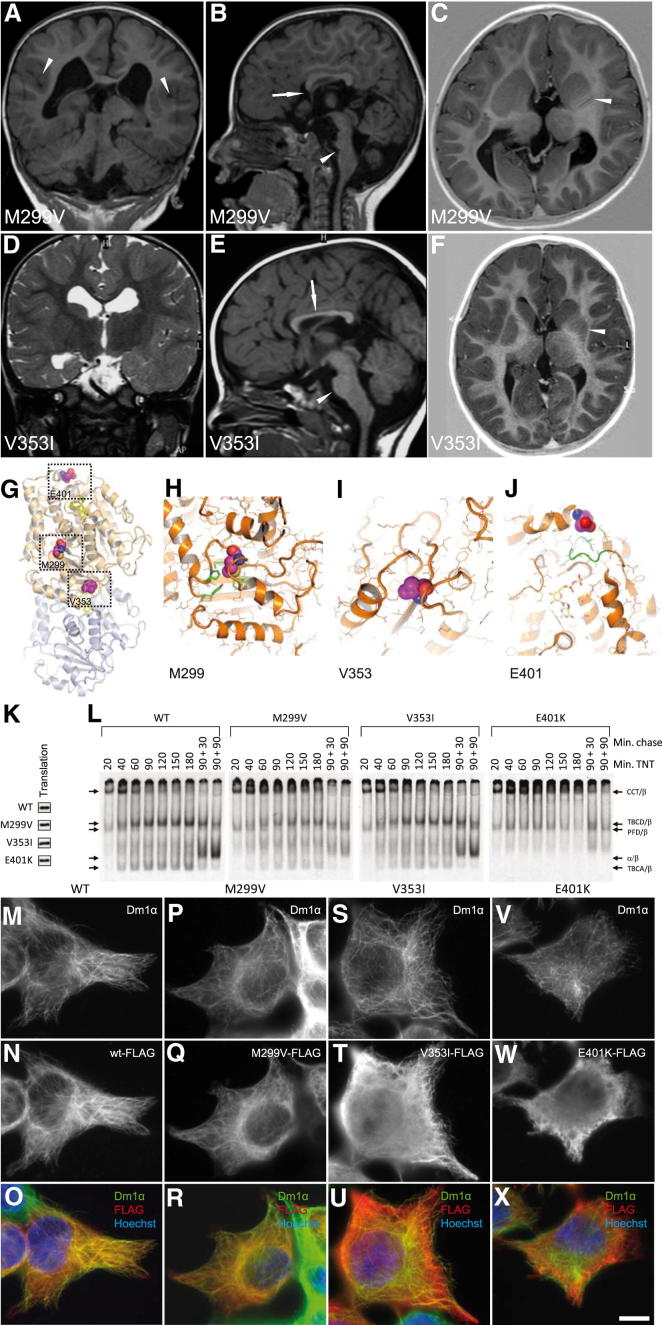
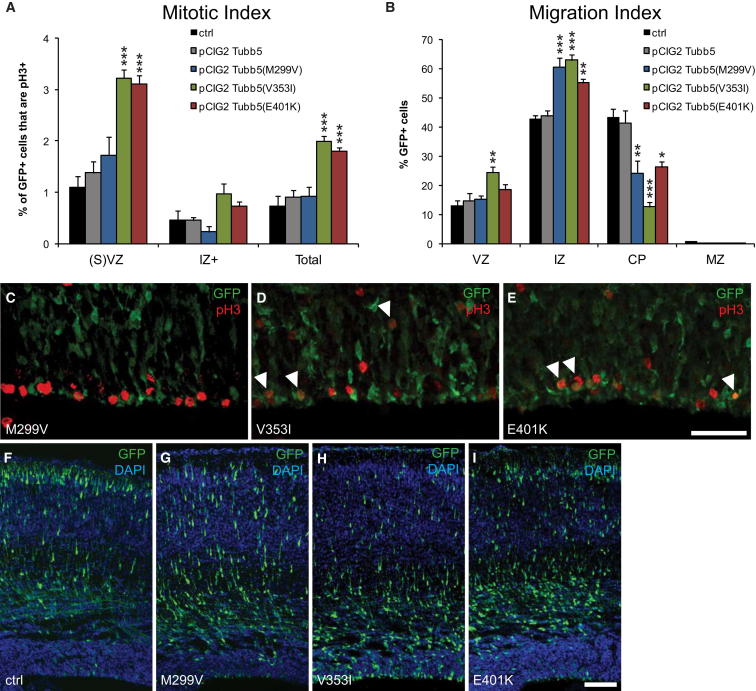
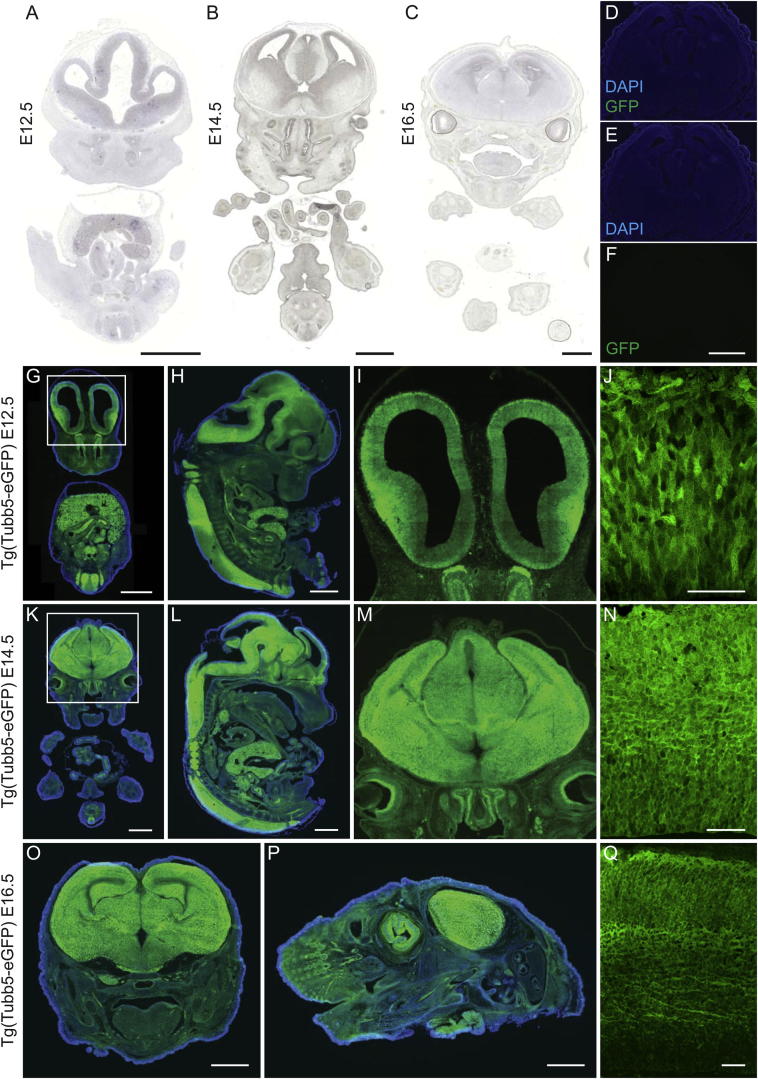
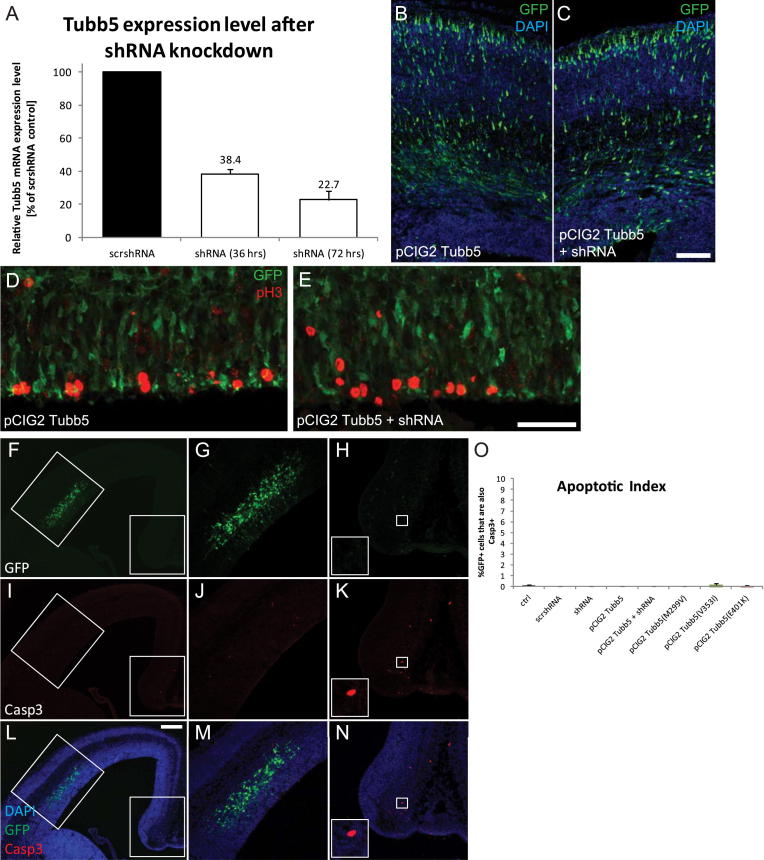
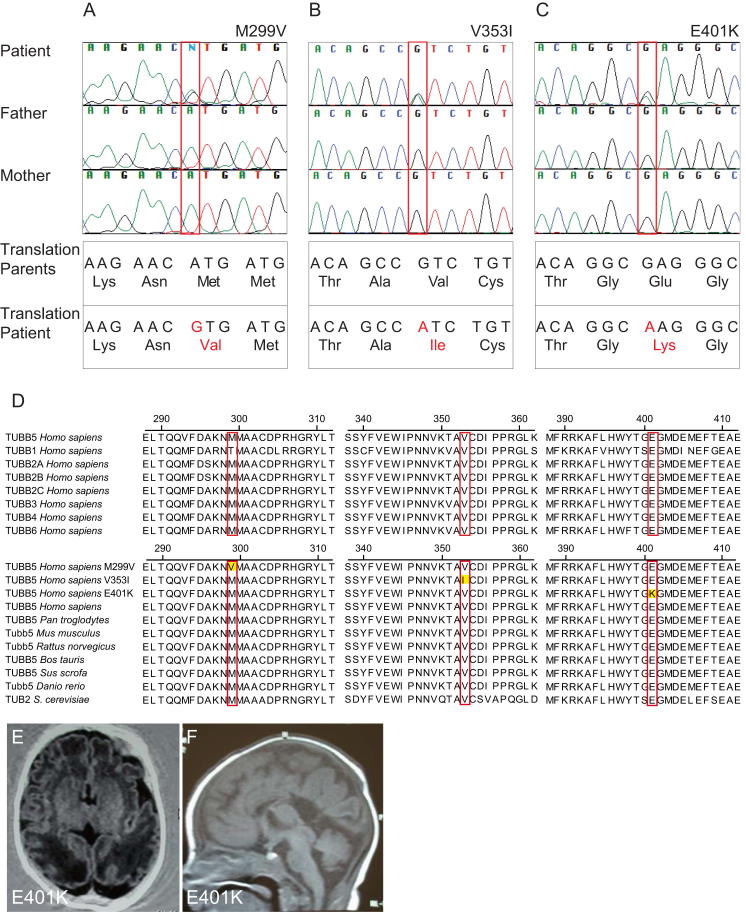
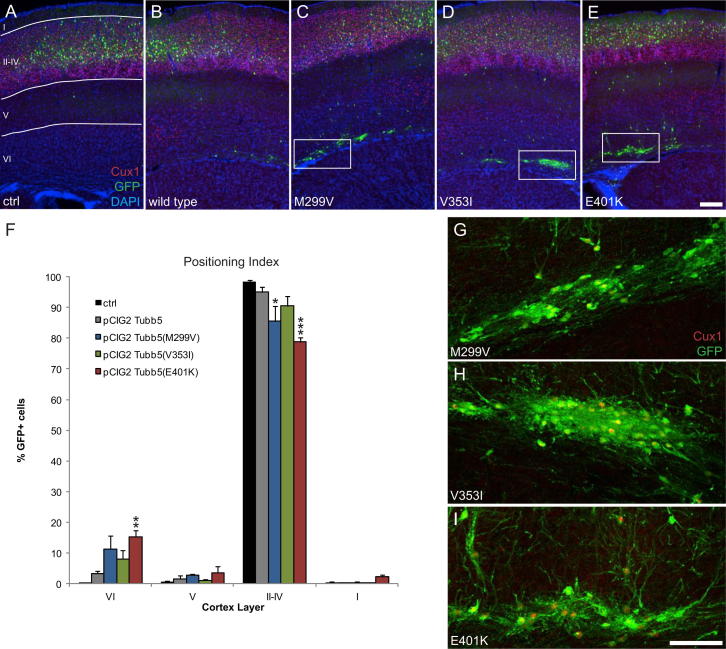
The formation of the mammalian cortex requires the generation, migration, and differentiation of neurons. The vital role that the microtubule cytoskeleton plays in these cellular processes is reflected by the discovery that mutations in various tubulin isotypes cause different neurodevelopmental diseases, including lissencephaly (TUBA1A), polymicrogyria (TUBA1A, TUBB2B, TUBB3), and an ocular motility disorder (TUBB3). Here, we show that Tubb5 is expressed in neurogenic progenitors in the mouse and that its depletion in vivo perturbs the cell cycle of progenitors and alters the position of migrating neurons. We report the occurrence of three microcephalic patients with structural brain abnormalities harboring de novo mutations in TUBB5 (M299V, V353I, and E401K). These mutant proteins, which affect the chaperone-dependent assembly of tubulin heterodimers in different ways, disrupt neurogenic division and/or migration in vivo. Our results provide insight into the functional repertoire of the tubulin gene family, specifically implicating TUBB5 in embryonic neurogenesis and microcephaly.


Figures

None
Graphical abstract
Figure 1
Figure 1
Tubb5 Is Highly Expressed in the Developing Mouse and Human Brain (A) Relative expression levels of β-tubulin genes in the developing mouse brain determined by quantitative real-time PCR at E10.5, E12.5, E14.5, E16.5, and E18.5 and postnatal days zero (P0) and six (P6) (n = 3). Note the early onset and consistently high expression of Tubb5. (B) Relative expression levels of all the human β-tubulin genes in the developing brain at GW13 and GW22. (C–H) In situ hybridization results obtained with an antisense probe specific for Tubb5 at E12.5 (C and D), E14.5 (E and F), and E16.5 (G and H). (D), (F), and (H) show higher magnifications of (C), (E), and (G), respectively. Tubb5 is detected throughout the developing cortex with strong expression in the preplate at E12.5, and in the SVZ at E14.5. (I–X) Antibody staining for Dcx (I–L), Tuj (M-P), Tbr2 (Q–T), and Pax6 (U–X) performed on coronal sections of the Tg (Tubb5-EGFP) mouse line at E14.5. Grey scale images of (J), (N), (R), and (V) are shown in (K) and (L), (O) and (P), (S) and (T), and (W) and (X). All markers were found to colocalize with or in GFP-positive cells. Scale bars show 500 μm in (C), (E), and (G); 50 μm in (D), (F), and (H); 50 μm in (U); and 10 μm in (V). Error bars in (A) and (B) show SEM. See also Figure S1.
Figure 2
Figure 2
Tubb5 Depletion Perturbs Progenitor Mitosis and Alters the Positioning of Postmitotic Neurons (A) Schematic illustrating the three different in utero electroporation experiments. After electroporation at E14.5, embryos were harvested 36 hr later to assess the mitotic index, harvested 72 hr later to assess the migration index, or harvested at P17 to assess the positioning index. (B) Quantitation of the mitotic index, showing the relative proportion of GFP positive cells that are also pH3 positive in the VZ and SVZ, IZ, and across all zones (Total) for the following conditions: scrambled shRNA (scrshRNA); shRNA targeting Tubb5 (shRNA); overexpression of Tubb5 (pCIG2 Tubb5); and the rescue experiment (pCIG2-Tubb5 + shRNA). Note that Tubb5 depletion results in a significant increase in the mitotic index in comparison to the scrambled control, overexpression, and rescue experiments (n ≥ 5; VZ and SVZ: p < 0.001; Total: p < 0.05). (C and D) Representative images for the mitotic index experiment. Arrowheads highlight colocalization of GFP-expressing cells (green) with pH3 staining (red). (E and F) Representative images showing the migration assessment following Tubb5 depletion. Note the conspicuous reduction in the proportion of GFP-positive cells reaching the CP. (G) Quantification of the percentage of GFP-positive cells in the VZ, IZ, CP, and marginal zone (MZ) for the migration index following treatment with a scrshRNA; an shRNA targeting Tubb5 (shRNA); a Tubb5 expression construct (pCIG2 Tubb5); and the rescue experiment (shRNA + pCIG2 Tubb5). Tubb5 depletion results in a moderate but significant increase in the percentage of GFP-positive cells located in the VZ and IZ and a decrease in the percentage of GFP-positive cells in the CP (n ≥ 5, VZ: p < 0.05; IZ: p < 0.05; CP: p < 0.01). This phenotype was partially rescued by coexpression of a Tubb5 isotype lacking the shRNA targeting sequence (pCIG2 Tubb5 + shRNA). Note that overexpression of Tubb5 by itself has no effect on migration (pCIG2 Tubb5). (H) Quantification of the percentage of GFP-positive cells in the six layers of the P17 cortex following treatment with an scrshRNA and a shRNA targeting Tubb5Tubb5 depletion results in a significant increase in the percentage of neurons in layer VI (n = 4; p < 0.05), with a concomitant decrease in layers II–IV (n = 4; p < 0.01). (I and J) Representative images for the positioning index in (H). The red channel shows Cux1 staining in layers II–IV. Scale bars show 50 μm in (D), 100 μm in (F), and 200 μm in (J). Error bars in (B), (G), and (H) show mean ± SEM.p < 0.05, ∗∗p < 0.01, ∗∗∗p < 0.001. MZ, marginal zone; scrshRNA, scrambled shRNA. See also Figure S2.
Figure 3
Figure 3
Mutations in TUBB5 Cause Microcephaly and Affect the Generation of Tubulin Heterodimers in Different Ways (A–F) Coronal (A and D), sagittal (B and E), and horizontal (C and F) MRIs of two patients with TUBB5-associated microcephaly (M299V and V353I). (A–C) The patient with the M299V mutation has microcephaly (OFC of −2.5 SD), focal polymicrogyria (shown with arrowheads in A), severe brainstem hypoplasia (shown with an arrowhead in B), partial agenesis of the corpus callosum (shown with an arrow in B), and dysmorphic basal ganglia with streaks of white matter (highlighted with an arrowhead in C). (D–F) The patient with the V353I mutation has microcephaly (OFC of −4.0 SD), a hypoplastic corpus callosum (shown with an arrow in E), and a dysmorphic basal ganglia with streaks of white matter running through the lenticular nucleus (shown with an arrowhead in F). (G) Structural representation of a tubulin heterodimer highlighting the positions of the mutated residues. The M299 residue is centrally located and is associated with a deep hydrophobic pocket. V353 lies on the intradimer interface, in contrast to E401, which is located at the interdimer interface. (H–J) Higher-resolution images showing the mutated residues within the three-dimensional structure of the tubulin heterodimer. (H) The M299 side chain is surrounded by hydrophobic residues (M267, P305, Y310, F367, shown in green) that could be disrupted by replacement with valine. (J) E401 lies in proximity to a loop (98–104, shown in green) that is critical for the binding of GTP (shown in yellow). (K) Denaturing gel of in vitro 35S-methionine-labeled transcription/translation reaction products for wild-type and TUBB5 mutants showing similar translational efficiencies. (L) Kinetic analysis on nondenaturing gels of the products of in vitro transcription/translation reactions for wild-type and TUBB5 mutants. Arrows (top to bottom) denote the migration positions of the chaperonin (CCT)/β-tubulin binary complex (CCT/β), the TBCD/β-tubulin cocomplex, the prefoldin (PFD)/β-tubulin binary complex (PFD/β), the native tubulin heterodimer (α/β), and the TBCA/β-tubulin cocomplex (TBCA/β), each assigned on the basis of their characteristic electrophoretic mobilities. Note that the V353I mutant polypeptide behaved similarly to wild-type controls, whereas there was a diminished heterodimer yield in the case of M299V and little or no detectable heterodimer in the case of E401K. Note also the absence of TBCA/β-tubulin and TBCD/β-tubulin cocomplexes and a relatively long persistence of the PFD/β-tubulin cocomplex in the case of reactions performed with the E401K mutation. Min. chase indicates that reaction products generated after 90 min were further chased with added native bovine brain tubulin so as to drive the generation of tubulin heterodimers for the times shown. (M–X) Expression of FLAG-tagged wild-type and mutant (M299V, V353I, and E401K) TUBB5 in cultured Neuro-2a cells. Staining with the anti-FLAG antibody is shown in red and the microtubule cytoskeleton visualized using an anti-α-tubulin antibody (shown in green). Note that wild-type FLAG-tagged TUBB5, as well as the corresponding M299V and V353I mutants, incorporated into the microtubule lattice (M–O, P–R, and S–U, respectively). This contrasts with the E401K protein, which is distributed throughout the cytoplasm and failed to incorporate into the cytoskeletal network (V–X). Scale bar in (X) is 10 μm. See also Figure S3.
Figure 4
Figure 4
Expression of Disease-Causing Tubb5 Mutations In Vivo (A) Quantification of the mitotic index for cells electroporated with control vectors (ctrl), a Tubb5 expression vector (pCIG2-Tubb5; note that this control is also presented in Figure 2B), and the mutants identified (pCIG2-Tubb5(M299V), pCIG2-Tubb5(V353I), pCIG2-Tubb5(E401K)). Tubb5 overexpression resulted in a mitotic index that was comparable to controls. In contrast, there was a large increase in the percentage of GFP-positive cells that are also pH3 positive in the VZ and SVZ when expressing the E401K and V353I mutant constructs (n ≥ 5; E401K and V353I: VZ + SVZ: p < 0.001; Total: p < 0.001). This increase in the mitotic index was also apparent when overexpressing the M299V mutation, although the effect was not statistically significant (n ≥ 5; p > 0.05). (B) Quantification of the migration index for all five conditions (note that the Tubb5 overexpression control is also presented in Figure 2G). Overexpression of the mutants results in an accumulation of GFP-positive cells in the IZ with a concomitant decrease in the CP (n = 5; M299V: IZ: p < 0.001; CP: p < 0.01; V353I: VZ: p < 0.01; IZ: p < 0.001; CP: p < 0.001; E401K: IZ: p < 0.01; CP: p < 0.05) that was not observed when overexpressing Tubb5 alone (n = 5, p > 0.05). (C–E) Representative images used for mitotic index assessment with arrowheads showing colocalization of GFP-expressing cells (green) with pH3 staining (red). (F–I) Representative images used for migration assessment. Note the decrease in the relative number of cells reaching the upper layers of the cortex when expressing the mutant constructs in comparison to controls (p < 0.05, ∗∗p < 0.01, ∗∗∗p < 0.001). Scale bars show 50 μm in (E) and 100 μm in (I). (A) and (B) show mean ± SEM. See also Figure S4.
Figure S1
Figure S1
Negative Controls for Figure 1 and Analysis of the Tg(Tubb5-EGFP) Mouse Line (A–C) Negative controls (sense probe) for the in situ hybridization experiments shown in Figure 1 for the indicated time points (E12.5, E14.5, E16.5). (D–F) Littermate control of the Tg(Tubb5-EGFP) embryo shown in Figure 1, negative for the GFP transgene. Images were captured employing the same settings as those shown in (G)-(Q); no background fluorescence can be detected. (G–Q) Representative coronal (G, I-K, M-O, Q) and sagittal (H, L, P) sections of Tg(Tubb5-EGFP) embryos at the indicated time points (E12.5, E14.5, E16.5). (I) and (M) show magnifications of the boxed regions shown in (G) and (K). High magnification confocal images of the developing cortex are shown in (J), (N), (Q). Note the robust expression of EGFP throughout the developing cortex, consistent with our in situ studies. Scale bars show 1000 μm for (A–C), (G), (H), (K), (L), (O) and (P), 500 μm in (F), 50 μm for (J), (N) and (Q). DAPI staining (shown in blue) is visible in (G), (H), (K), (L), (O) and (P).
Figure S2
Figure S2
Supplemental Information to Figure 2 and Assessment of Apoptosis (A) Relative expression level of Tubb5 mRNA in Neuro2a cells following transfection with a pSuper vector driving expression of a shRNA targeted to the 3′ UTR of this gene. This results in a ∼62% knockdown (36 hr) and ∼77% knockdown (72 hr) of Tubb5 mRNA levels. The error bars show the SEM (n = 3 independent experiments for each time point). (B and C) Representative images for the assessment of neuronal positioning following electroporation of pCIG2 Tubb5 and pCIG2 Tubb5 + shRNA. (D and E) Representative images for the mitotic index assessment when electroporating with pCIG2 Tubb5 and pCIG2 Tubb5 + shRNA. (F–N) Representative image of the apoptosis experiments showing the GFP channel (F-H), activated caspase-3 staining (I-K) and the merged image (L-N). Boxed regions in F, I and L are shown in the adjacent panels (G, J, M) and (H, K, N). Panels H, K and N highlight the mediodorsal region of the cortex as an internal positive control for caspase-3 staining. The magnified region in H, K and N show an apoptotic cell positive for caspase-3. (O) Quantification of GFP+ cells co-localizing with activated capase-3. All conditions show less than 1% of co-localization. An ANOVA followed by a multiple comparison test revealed no significant difference between the relevant experiments (scrshRNA, shRNA, pCIG2 Tubb5 and pCIG2 Tubb5 + shRNA; ctrl, pCIG2 Tubb5, pCIG2 Tubb5(M299V), pCIG2 Tubb5(V353I) and pCIG2 Tubb5(E401K)). Scale bars show 50 μm in (C), 100 μm in (E), and 200 μm in (L).
Figure S3
Figure S3
Supplemental Information to Figure 3 (A–C) Sequencing traces for patients and parents showing the mutations in TUBB5 for M299V, V353I, and E401K together with the amino acid conversions. All mutations are de novo. (D) Protein sequence alignment of β-tubulins present in humans (upper panel). Note the high conservation between the isoforms for all three loci, with the exception of T299 in TUBB1, the most distinct of the human isoforms. The lower panel shows an alignment of TUBB5 homologs in a variety of species. Note that the three disease causing residues are conserved from yeast to man. (E and F) Horizontal (E) and sagittal (F) MRI images taken at 4 months of age for the patient harboring the E401K mutation. This individual presented with microcephaly (−4 SD OFC), partial posterior agenesis of the corpus callosum, and dysmorphic basal ganglia.
Figure S4
Figure S4
Positioning Index following Expression of Mutant Tubb5 In Vivo, Related to Figure 4 (A–E) Representative images of P17 mouse brains following in utero electroporation at E14.5 with plasmids expressing: (A) scrambled shRNA; (B) Tubb5 wt; (C) Tubb5 M299V, (D) Tubb5 V353I, and (E) Tubb5 E401K. The cortical regions analyzed are indicated in A. The red channel shows Cux1 staining in layers II-IV. Note the increased number of ectopic cells in deep cortical layers when overexpressing the Tubb5 mutants (M299V, V353I, E401K). (F) Quantification of the percentage of GFP positive cells in layers I-VI of the P17 cortex for all five conditions (note that the control is also presented in Figure 2H; see also Table S2). Overexpression of the Tubb5 mutants results in fewer cells in superficial layers of the cortex (M299V; II-IV: p < 0.05, E401K; II-IV: p < 0.001), and an accumulation of GFP positive cells in the deeper layers (E401K; n = 3; VI: p < 0.01), but this was not significant in the case of the V353I mutation (n = 3; p > 0.05). Magnification of the boxed regions in (C), (D), and (E), showing ectopic clusters of GFP positive cells. Note that a number of these cells are also positive for the post-mitotic marker Cux 1. p < 0.05, ∗∗p < 0.01, ∗∗∗p < 0.001. Data are mean ± SEM. Scale bars show 200 μm in (E) and 100 μm in (I).

Similar articles

Cited by

References

    1. Ayala R., Shu T., Tsai L.H. Trekking across the brain: the journey of neuronal migration. Cell. 2007;128:29–43. - PubMed
    1. Braun A., Breuss M., Salzer M.C., Flint J., Cowan N.J., Keays D.A. Tuba8 is expressed at low levels in the developing mouse and human brain. Am. J. Hum. Genet. 2010;86:819–822. author reply 822–813. - PMC - PubMed
    1. Cowan N.J., Lewis S.A. Type II chaperonins, prefoldin, and the tubulin-specific chaperones. Adv. Protein Chem. 2001;59:73–104. - PubMed
    1. Edwards A., Treiber C.D., Breuss M., Pidsley R., Huang G.J., Cleak J., Oliver P.L., Flint J., Keays D.A. Cytoarchitectural disruption of the superior colliculus and an enlarged acoustic startle response in the Tuba1a mutant mouse. Neuroscience. 2011;195:191–200. - PMC - PubMed
    1. Feng Y., Walsh C.A. Protein-protein interactions, cytoskeletal regulation and neuronal migration. Nat. Rev. Neurosci. 2001;2:408–416. - PubMed

Supplemental References

    1. Murtaugh, L.C., Chyung, J.H., and Lassar, A.B. (1999). Sonic hedgehog promotes somitic chondrogenesis by altering the cellular response to BMP signaling. Genes Dev. 13, 225–237. - PMC - PubMed
    1. Vandesompele, J., De Preter, K., Pattyn, F., Poppe, B., Van Roy, N., De Paepe, A., and Speleman, F. (2002). Accurate normalization of real-time quantitative RT-PCR data by geometric averaging of multiple internal control genes. Genome Biol. 3, RESEARCH0034. - PMC - PubMed

Publication types

MeSH terms