Review
. 2013 Feb;24(1):95-104.
doi: 10.1016/j.copbio.2012.10.021. Epub 2012 Dec 13.

Progress toward single cell metabolomics

Affiliations
Review

Progress toward single cell metabolomics

Stanislav S Rubakhin et al. Curr Opin Biotechnol. 2013 Feb.

Abstract

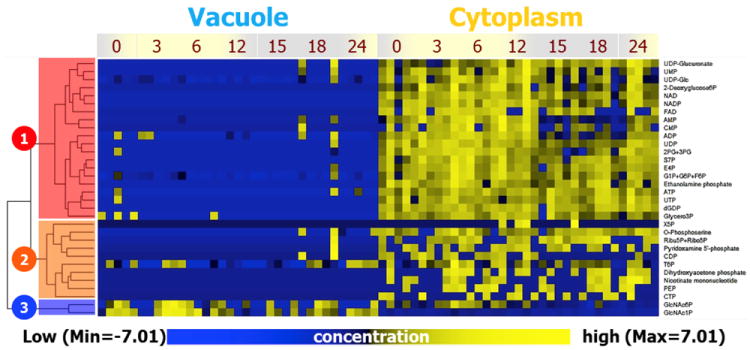
The metabolome refers to the entire set of small molecules, or metabolites, within a biological sample. These molecules are involved in many fundamental intracellular functions and reflect the cell's physiological condition. The ability to detect and identify metabolites and determine and monitor their amounts at the single cell level enables an exciting range of studies of biological variation and functional heterogeneity between cells, even within a presumably homogenous cell population. Significant progress has been made in the development and application of bioanalytical tools for single cell metabolomics based on mass spectrometry, microfluidics, and capillary separations. Remarkable improvements in the sensitivity, specificity, and throughput of these approaches enable investigation of multiple metabolites simultaneously in a range of individual cell samples.


Conflict of interest statement

The authors declare they have no conflicts of interest.

Figures

Figure 1
Figure 1
Analyses of vacuolar and cytoplasmic phosphate metabolites of Chara australis based on hierarchical cluster analysis shows that they are distinct. Some dependence on the 24 h light/dark cycle is detected. Three major data clusters represent cytoplasm-type metabolites (clusters 1 and 2) and vacuole-type metabolites (cluster 3). Reprinted from an open access source [30].
Figure 2
Figure 2
Live single-cell mass spectrometry was used to examine metabolite content in a variety of cells, including leaf cells from Pelargonium zonale. A representative mass spectrum of sample collected from an individual cell using a nanoelectrospray tip (tip is encircled). Adapted with permission from [31]. Copyright 2012 American Chemical Society.
Figure 3
Figure 3
Sequential investigation of samples with several analytical technologies yields increased chemical information content and metabolome coverage. The LDI-MS/SIMS/CRM spatial correlation strategy is illustrated using tall perennial grass Miscanthus x giganteus cross sections. The LDI-MS grid (center top) is color-coded, corresponding to the intensity of m/z = 45 ions, obtained by laser desorption/ionization excitation spots on 100 μm centers. The yellow circle highlights the spot where high-resolution imaging was performed by both negative (m/z = 25, C2H-, top left) and positive (m/z = 43, C3H7+, bottom left) ion SIMS, as well as CRM, characterized by the cellulose band, 345–390 cm-1 (top right), and the lignin band, 1550–1650 cm-1 (bottom right). (Bottom center) Composite CRM image combining information from both cellulose (green) and lignin (yellow) bands. Reprinted with permission from [33]. Copyright 2010 American Chemical Society.
Figure 4
Figure 4
LacCer-BODIPY-FL metabolism in seven individual granule neurons is revealed by capillary electrophoresis. Representative electropherograms are shown at (A) full scale and (B) expanded scale. Several unidentified compounds marked with a question mark are also observed. (Reprinted (adapted) with permission from [5]. Copyright 2012 American Chemical Society)

References

    1. Schwab W. Metabolome diversity: Too few genes, too many metabolites? Phytochemistry. 2003;62:837–849. - PubMed
    1. Wang D, Bodovitz S. Single cell analysis: The new frontier in ‘omics’. Trends Biotechnol. 2010;28:281–290. - PMC - PubMed
    1. Kell DB. Metabolomics and systems biology: Making sense of the soup. Curr Opin Microbiol. 2004;7:296–307. - PubMed
    1. Paul Lee WN, Wahjudi PN, Xu J, Go VL. Tracer-based metabolomics: Concepts and practices. Clin Biochem. 2010;43:1269–1277. - PMC - PubMed
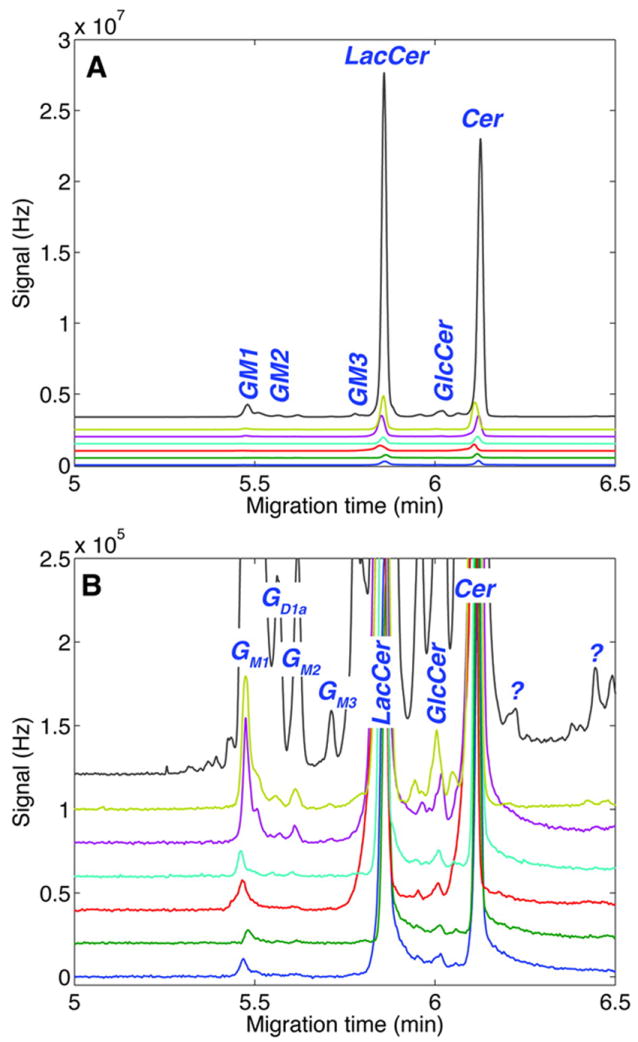
    1. Essaka DC, Prendergast J, Keithley RB, Palcic MM, Hindsgaul O, Schnaar RL, Dovichi NJ. Metabolic cytometry: Capillary electrophoresis with two-color fluorescence detection for the simultaneous study of two glycosphingolipid metabolic pathways in single primary neurons. Anal Chem. 2012;84:2799–2804. A exciting example of wide dynamic range capillary electrophoresis applied to investigate labeled compound metabolism in individual mammalian cells. The work exemplifies the use of CE in a functional metabolomics study. - PMC - PubMed

Publication types

LinkOut - more resources