. 2013 Mar:68:63-74.
doi: 10.1016/j.neuroimage.2012.11.039. Epub 2012 Dec 12.

Brain development and aging: overlapping and unique patterns of change

Affiliations

Brain development and aging: overlapping and unique patterns of change

Christian K Tamnes et al. Neuroimage. 2013 Mar.

Abstract

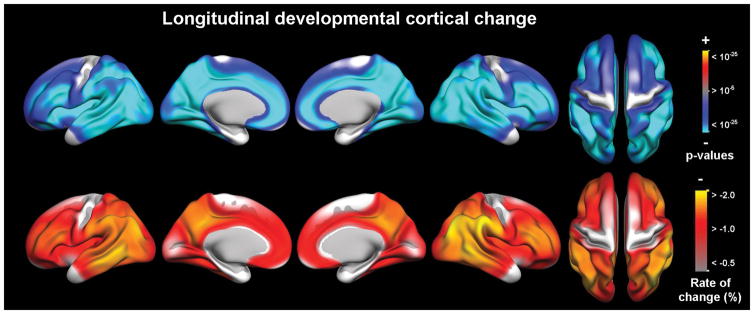
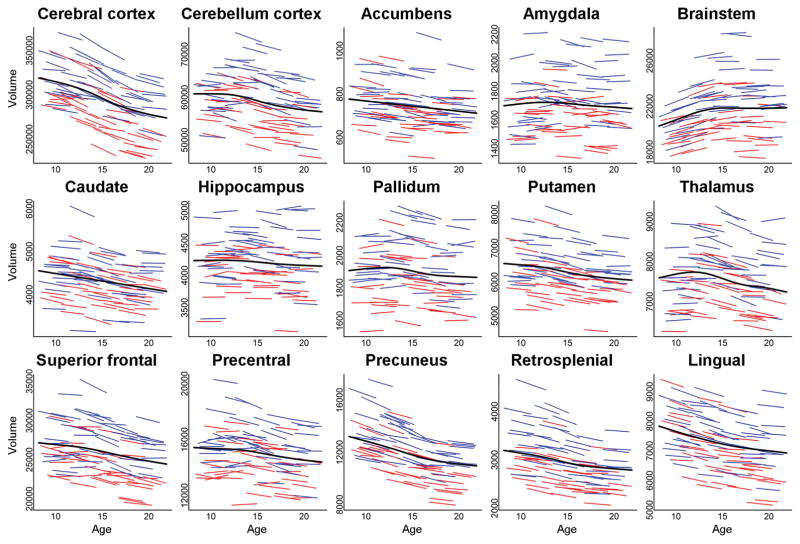
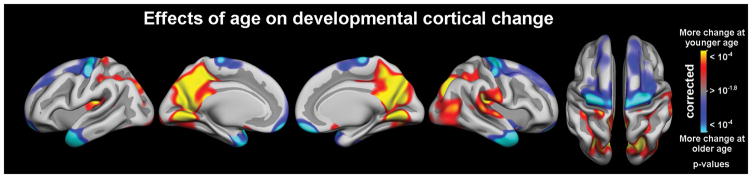
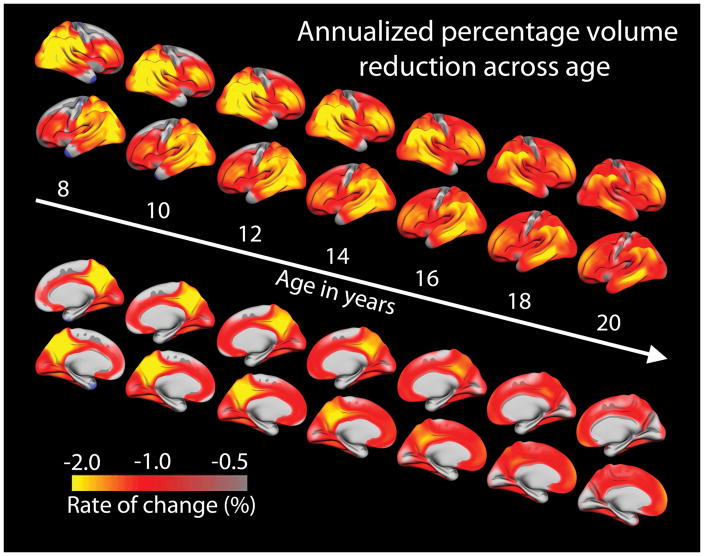
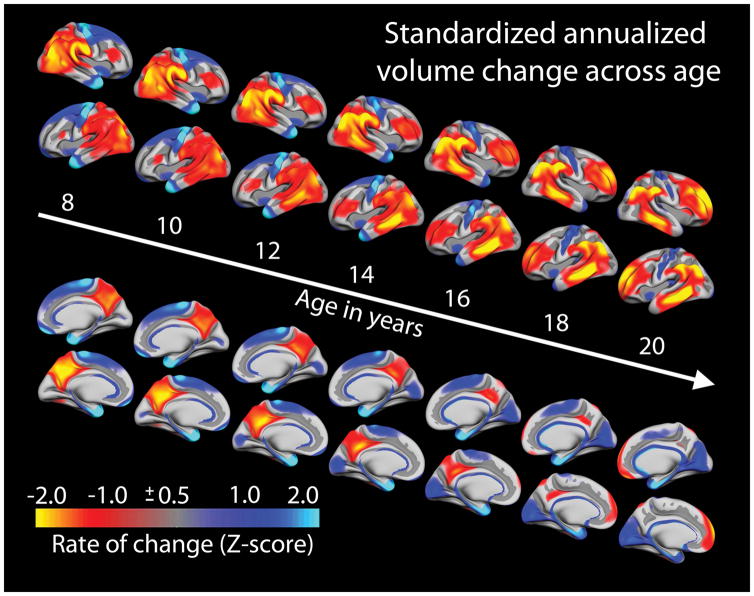
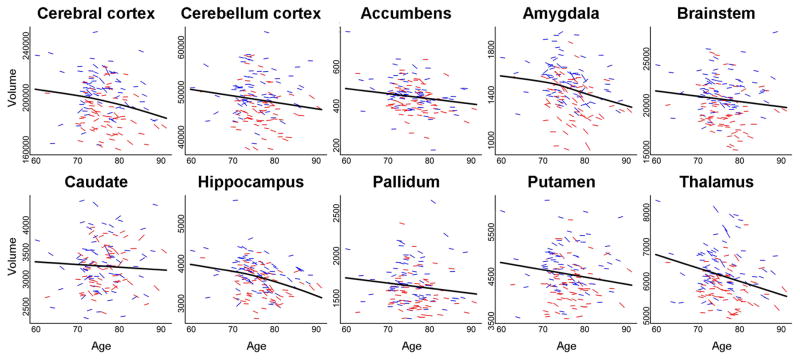
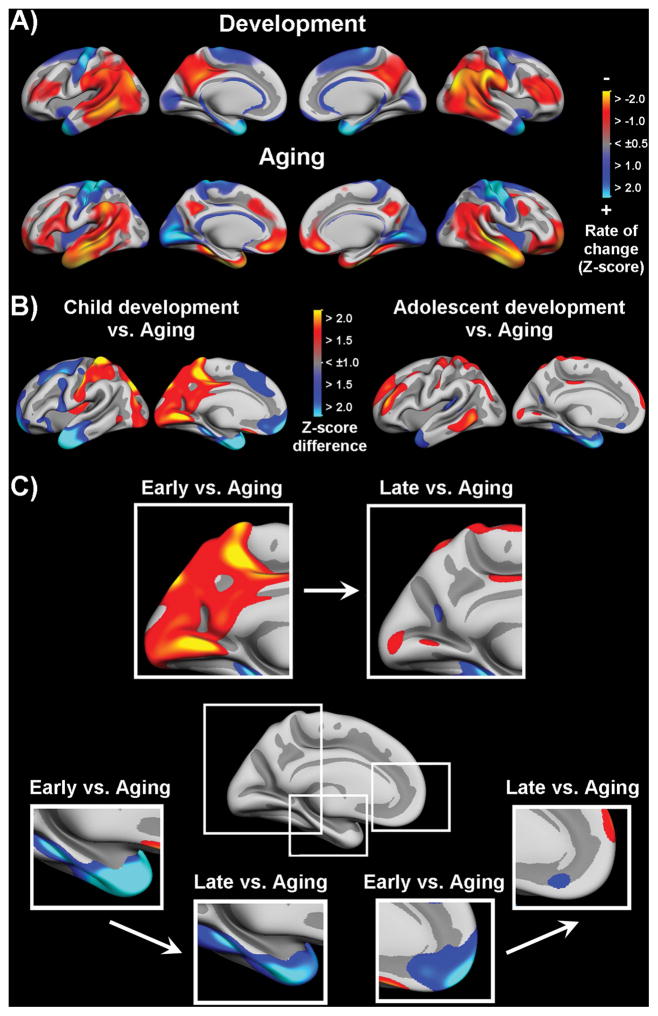
Early-life development is characterized by dramatic changes, impacting lifespan function more than changes in any other period. Developmental origins of neurocognitive late-life functions are acknowledged, but detailed longitudinal magnetic resonance imaging studies of brain maturation and direct comparisons with aging are lacking. To these aims, a novel method was used to measure longitudinal volume changes in development (n=85, 8-22 years) and aging (n=142, 60-91 years). Developmental reductions exceeded 1% annually in much of the cortex, more than double to that seen in aging, with a posterior-to-anterior gradient. Cortical reductions were greater than the subcortical during development, while the opposite held in aging. The pattern of lateral cortical changes was similar across development and aging, but the pronounced medial temporal reduction in aging was not precast in development. Converging patterns of change in adolescents and elderly, particularly in the medial prefrontal areas, suggest that late developed cortices are especially vulnerable to atrophy in aging. A key question in future research will be to disentangle the neurobiological underpinnings for the differences and the similarities between brain changes in development and aging.


Conflict of interest statement

Disclosure statement

Anders M. Dale is a founder and holds equity in CorTechs Labs, Inc., and also serves on the Scientific Advisory Board. The terms of this arrangement have been reviewed and approved by the University of California, San Diego, in accordance with its conflict of interest policies.

Figures

Fig. 1
Fig. 1. Longitudinal cortical change in development
General linear models were used to test the statistical significance of cortical volume change across the brain surface in children and adolescents (n = 85, 8–22 years), with time between the two scans included as a covariate. The significance of the effects and the rates of change were color coded and projected onto a semi-inflated template brain. The upper row shows the significance of the effects when a conservative threshold (p < 10−5) was used. The lower row shows annual percentage volume reductions.
Fig. 2
Fig. 2. Spaghetti plots for selected brain regions in development
Plots of volumes (mm3) by age (years) for selected brain regions in the sample of children and adolescents (n = 85, 8–22 years). Volumes from the left and right hemisphere were averaged. Blue lines denote boys and red lines denote girls. For each region, an assumption-free general additive model as function of age was fitted to accurately describe changes across the studied age-range. For the cortical regions shown in the lower row, these models indicate steeper reductions in adolescence in frontal regions (superior frontal and precentral) and steeper reductions at younger age in posterior regions (precuneus, retrosplenial and lingual).
Fig. 3
Fig. 3. Effects of age on cortical change rates in development
General linear models were used to test the significance of the effects of age on cortical volume change, with time between the two scans included as a covariate. Corrected for multiple comparisons (FDR 5%, corresponding to p < .016), blue-cyan areas indicate accelerating volume reductions with higher age, especially prominent in anterior regions, and red-yellow areas indicate decelerating reductions, especially in posterior regions.
Fig. 4
Fig. 4. Annual percentage cortical change across age in children and adolescents
Annualized percentage volume change was estimated per year and smoothed across the age-range by use of a smoothing spline approach (Fjell et al., 2010a), and shown in lateral and medial views (see also Video 1). At age 8 years, the most pronounced reductions are seen in the parietal lobes and the lateral occipital cortices. At age 20, substantial reductions are seen across most of the surface, including the frontal lobes and the anterior part of the lateral temporal lobes, but not in the medial temporal and occipital cortices. A general posterior-anterior age-gradient is seen both laterally and medially.
Fig. 5
Fig. 5. Standardized cortical change across age in children and adolescents
To illustrate relatively higher and relatively lower rates of change at different ages, the smoothed annual percentage volume changes (Fig. 4) were z-transformed across the surface for each hemisphere. Red-yellow areas indicate the largest relative cortical reductions at different ages, while blue-cyan areas indicate smaller relative reductions(see also Video 2). At age 8 years, larger than average volume reductions are seen primarily in the parietal lobes and in the lateral occipital cortices, while at age 20, relatively larger reductions are seen laterally in the frontal lobes and the inferior parietal and temporal cortices, as well as in anterior medial frontal areas.
Fig. 6
Fig. 6. Spaghetti plots for selected brain regions in aging
Plots of volumes (mm3) by age (years) for selected brain regions in the sample of elderly (n = 142, 60–91 years). Volumes from the left and right hemisphere were averaged. Blue lines denote males and redlines denote females. For each region, an assumption -free general additive model as function of age was fitted to accurately describe changes across the age-range.
Fig. 7
Fig. 7. Relative rates of cortical change in development and aging
A: To compare and contrast the pattern of cortical change in development and aging, annual percentage volume change was z-transformed for each hemisphere in children and adolescents (n = 85, 8–22 years) and elderly (n = 142, 60–91 years) separately. Red-yellow areas indicate thelargest relative cortical reductions within each group. The pattern of lateral cortical changes was similar in development and aging, except in the anterior part of the temporal lobes, but the characteristic pronounced medial fronto-temporal reduction in aging was not precast across development. B: Next, we calculated the differences between the smoothed estimated standardized volume changes (z-scores) in early development vs. aging (the difference between reductions at 8 years and at 75 years) and late development vs. aging (the difference between reductions at 20 years and at 75 years). Children showed larger relative parietal and occipital reductions than elderly participants, while the elderly showed larger frontal and temporal reductions. The patterns of relative changes in adolescent development and aging were much more similar, with the exception of the pronounced medial temporal reductions in aging. C: Highlights of some of the striking transitions from the relatively large differences between early development and aging to the much more similar changes taking place in late development and aging. Note the deviant pattern in the medial temporal lobe. Only the left hemisphere is shown in panels B and C, but results for the right hemisphere were similar.

References

    1. Benes FM. Myelination of cortical-hippocampal relays during late adolescence. Schizophr Bull. 1989;15:585–593. - PubMed
    1. Benes FM, Turtle M, Khan Y, Farol P. Myelination of a key relay zone in the hippocampal formation occurs in the human brain during childhood, adolescence, and adulthood. Arch Gen Psychiatry. 1994;51:477–484. - PubMed
    1. Blakemore SJ. Imaging brain development: The adolescent brain. NeuroImage. 2012;61:397–406. - PubMed
    1. Brain Development Cooperative Group. Total and regional brain volumes in a population-based normative sample from 4 to 18 years: The NIH MRI study of normal brain development. Cereb Cortex. 2012;22:1–12. - PMC - PubMed
    1. Brown TT, Jernigan TL. Brain development during the preschool years. Neuropsychol Rev In press. - PMC - PubMed

Publication types