Review
. 2013 Feb 2;9(2):167-74.
doi: 10.1039/c2mb25453k. Epub 2012 Dec 18.

Analysis of omics data with genome-scale models of metabolism

Affiliations
Review

Analysis of omics data with genome-scale models of metabolism

Daniel R Hyduke et al. Mol Biosyst. .

Abstract

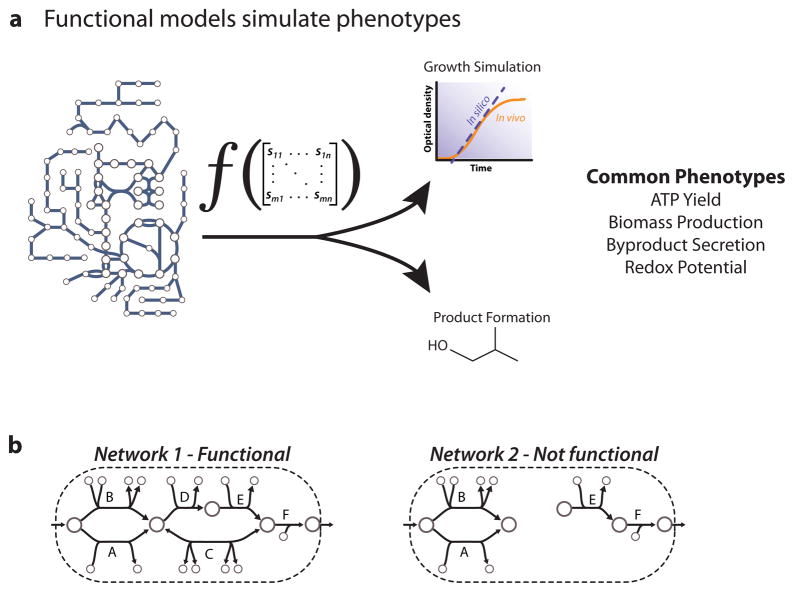
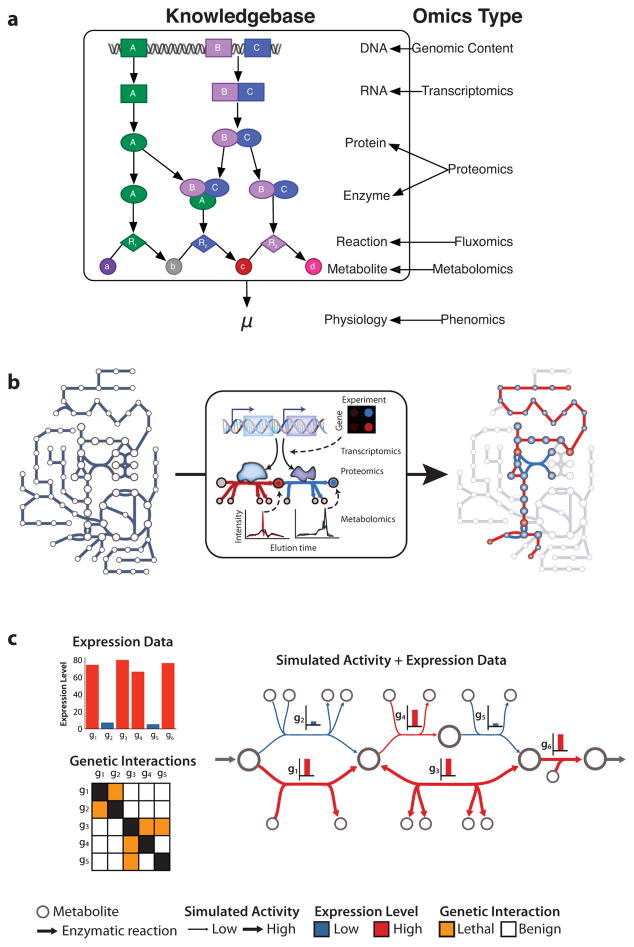
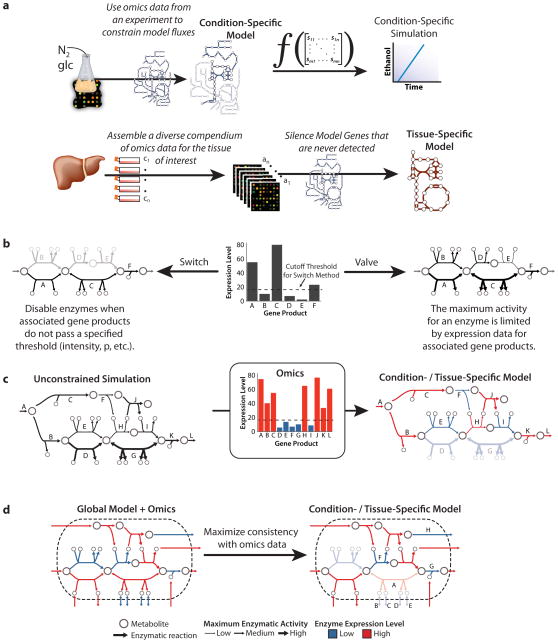
Over the past decade a massive amount of research has been dedicated to generating omics data to gain insight into a variety of biological phenomena, including cancer, obesity, biofuel production, and infection. Although most of these omics data are available publicly, there is a growing concern that much of these data sit in databases without being used or fully analyzed. Statistical inference methods have been widely applied to gain insight into which genes may influence the activities of others in a given omics data set, however, they do not provide information on the underlying mechanisms or whether the interactions are direct or distal. Biochemically, genetically, and genomically consistent knowledge bases are increasingly being used to extract deeper biological knowledge and understanding from these data sets than possible by inferential methods. This improvement is largely due to knowledge bases providing a validated biological context for interpreting the data.


Figures

Figure 1
Figure 1. Functional Network Models
A network reconstruction is functional if it can be converted to a mathematical model that can compute systems level properties, i.e. phenotypes. (a) For metabolic networks, the phenotypes of interest have historically focused on production of cellular materials, growth rates, and byproducts. For models created for a cell type or tissue, the functional phenotype depends on the cell type and state; e.g. activated macrophages would be expected to manufacture nitric oxide. (b) A simplified example is the ability to produce an output from an input. Network 1 would be termed functional whereas Network 2 would not be functional.
Figure 2
Figure 2. Direct comparison of omics data and models derived from metabolism knowledgebases
(a) Metabolism knowledgebases explicitly capture the relationship between genes and enzyme activities. The relationships between genomic loci, mRNAs, proteins, enzymatic, activities provide points to integrate omics data with metabolic network models. Model simulations of global phenotypes, such as specific growth rate (μ), afford the opportunity for comparison with phenomics data. (b) It is possible to overlay transcriptome, proteome, and metabolome data on a network model and gain insight into active metabolic pathways. (c) Examining omics data in the context of functional metabolic network models can direct research and provide insight. For example, when mRNA expression levels are overlaid on a model simulation we see a high expression level for gene g4 but the predicted flux for the associated reaction is relatively low. This discrepancy could be due a measurement error, g4 encoding for another unknown activity, or indicate that g4 is post-transcriptionally regulated. Examining genetic interaction data in the context of the network model reveals the underlying reason for lethalities. The double mutants Δg1Δg2, Δg3Δg4, and Δg3Δg5 are synthetic lethal pairs because they render the network non-functional.
Figure 3
Figure 3. Omics data may be used as a substitute for regulatory information to guide creation of condition- and tissue-specific models
(a) Omics data are increasingly used to create condition- and tissue-specific models which may then be used simulate specific phenotypes. Condition-specific models use omics data to limit which enzymes may participate in a specific simulation. For example, a nitrogen (N2) fixing bacterium can be expression profiled in a glucose (glc) minimal medium. These profiles are then used to identify which enzymes are expressed in the growth medium and create a condition-specific model. This condition-specific model may be used to simulate a condition-specific global phenotype, such as ethanol production. To create a tissue-specific model, it is important to assemble a compendium of omics data collected in a wide range of diverse conditions. These data are used to identify which of the organism’s genes may be expressed in the tissue and create a tissue-specific model. The tissue-specific model may be used to simulate phenotypes, or used with a new omics profile to create a condition specific model. (b) The approaches for using omics data to create condition- and tissue-specific models can be classified as a switch or a valve approach. In the switch approach, omics data are used to identify which gene products should be included in the constrained model; here, the reactions catalyzed by gene products B, D, and E are disabled because their expression levels did not exceed a threshold. In the valve approach, omics data are used to limit the activities for the associated enzymes. Therefore, enzymes associated with weakly expressed genes are still able to participate in a simulation albeit to a notably reduced extent. Due to errors and noise inherent in omics data, it is possible that the model will no longer function after disabling enzyme activities; thus, it may be necessary to disregard a limited number of expression measurements when employing a switch style approach. (c) In Becker et al., we used the simulation results from the unconstrained initial model to aid in identifying which expression measurements should be ignored. If an omics constrained model was be unable to simulate a specified phenotype, here the production of L from A, then we re-enabled a set of enzymes that restored the model to a functional state. If there were multiple alternative sets then the one that results in the minimum penalty score was selected. In Becker et al., the penalty score for a reaction was the product of the reaction’s flux in the unconstrained model and the distance of the expression value from the cutoff. Here, enzymes E, F, and I were reenabled (over D and G) because their fluxes were much smaller. (d) In Shlomi et al., the goal was to construct the smallest model that was maximally consistent with the omics data and does not contain dead end metabolites. Enzyme A is disabled despite a high expression level because it would be necessary to enable enzymes B, C, D, and E all of which had low expression levels. In spite of low expression values, enzymes F, G, and G are enabled because their activities are required for a greater number of highly expressed enzymes to be connected. Regardless of the approach, it is important to use additional types of evidence, such as biochemical literature, when available.

Similar articles

Cited by

References

    1. Zhang W, Li F, Nie L. Microbiology. 2010;156:287–301. - PubMed
    1. Palsson B, Zengler K. Nat Chem Biol. 2010;6:787–789. - PubMed
    1. Christian N, May P, Kempa S, Handorf T, Ebenhoh O. Mol Biosyst. 2009;5:1889–1903. - PubMed
    1. Shi L, et al. Nat Biotechnol. 2006;24:1151–1161. - PMC - PubMed
    1. Clarke R, et al. Nat Rev Cancer. 2008;8:37–49. - PMC - PubMed

Publication types

LinkOut - more resources