. 2013 Mar 1;591(5):1195-215.
doi: 10.1113/jphysiol.2012.244145. Epub 2012 Dec 17.

Imaging and characterization of stretch-induced ATP release from alveolar A549 cells

Affiliations

Imaging and characterization of stretch-induced ATP release from alveolar A549 cells

Ryszard Grygorczyk et al. J Physiol. .

Abstract

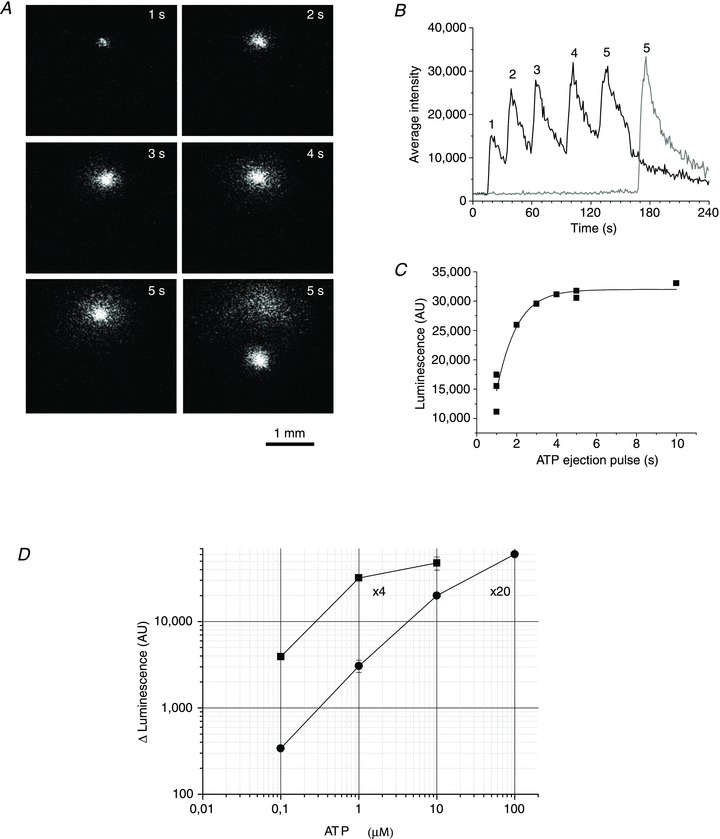
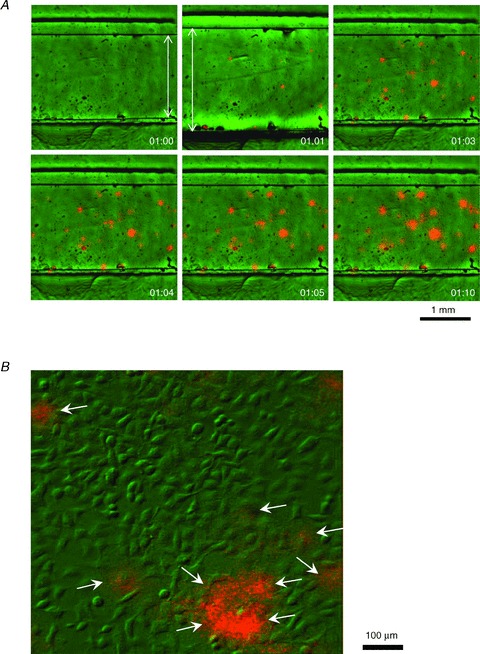
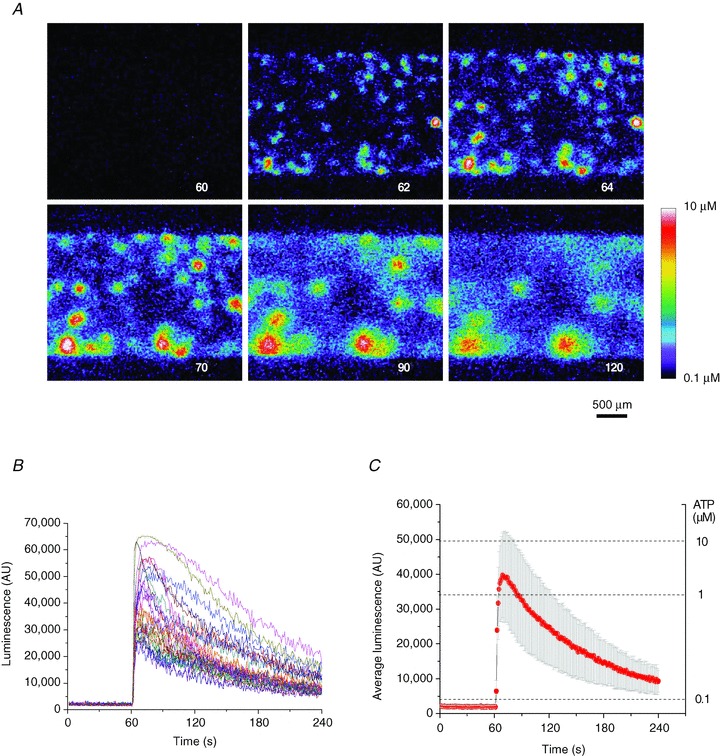
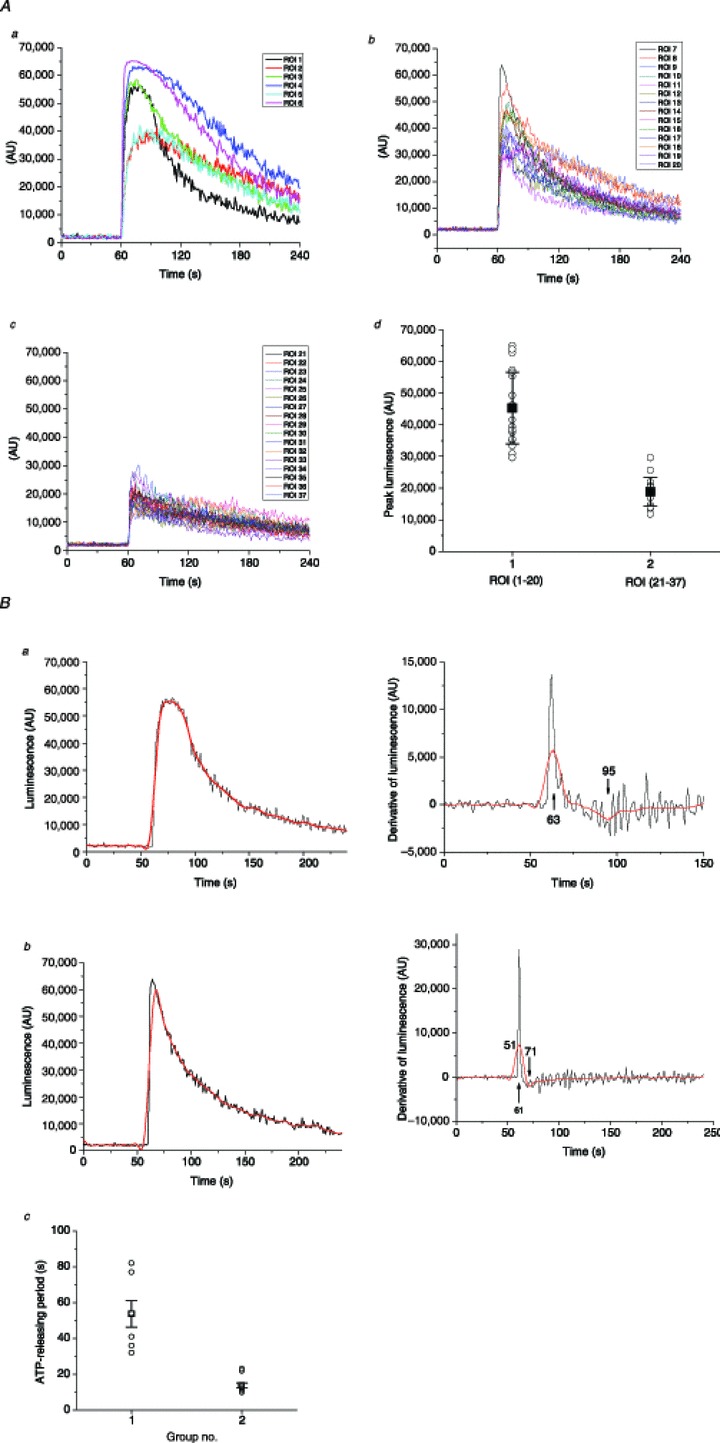
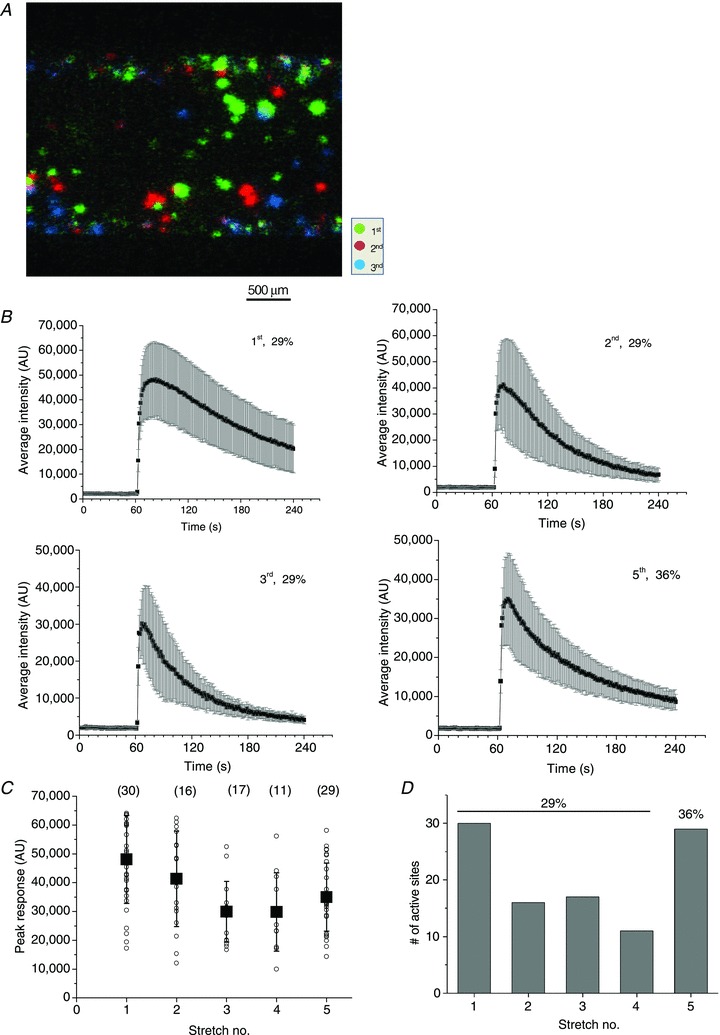
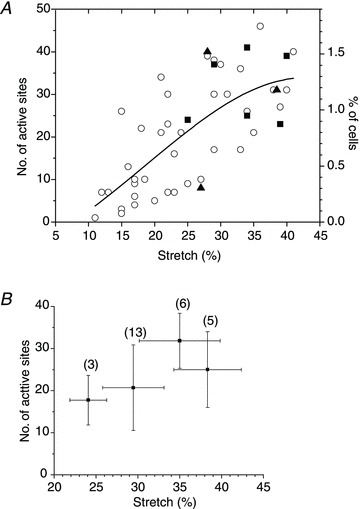
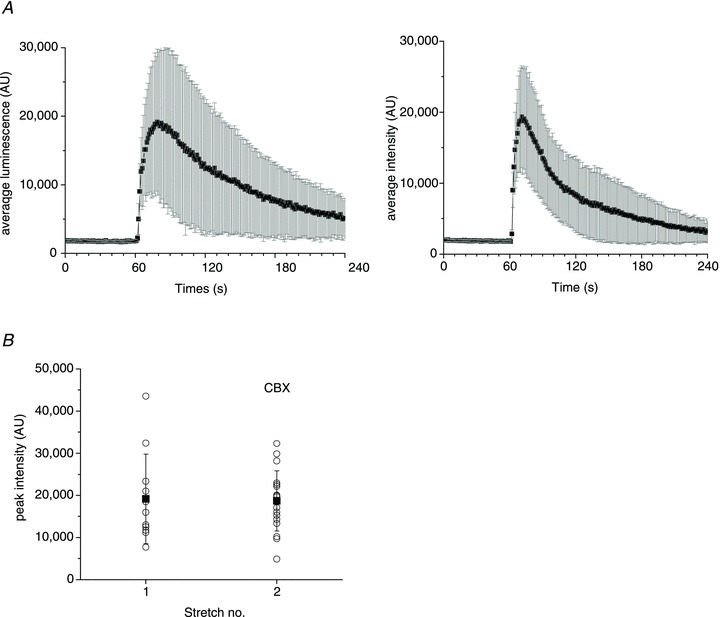
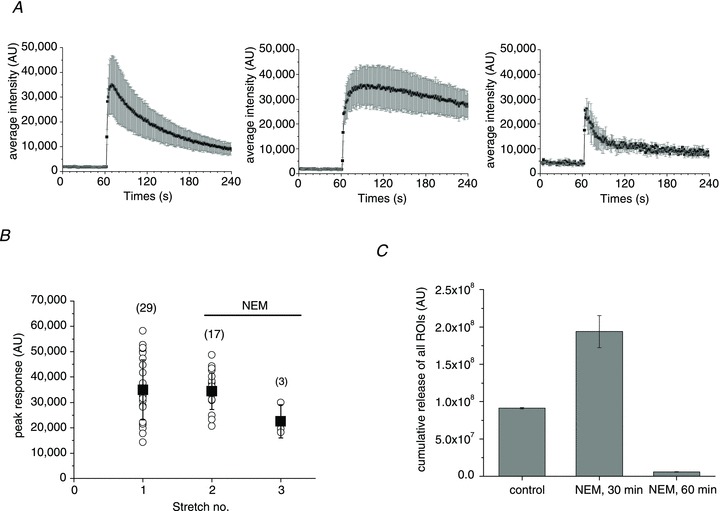
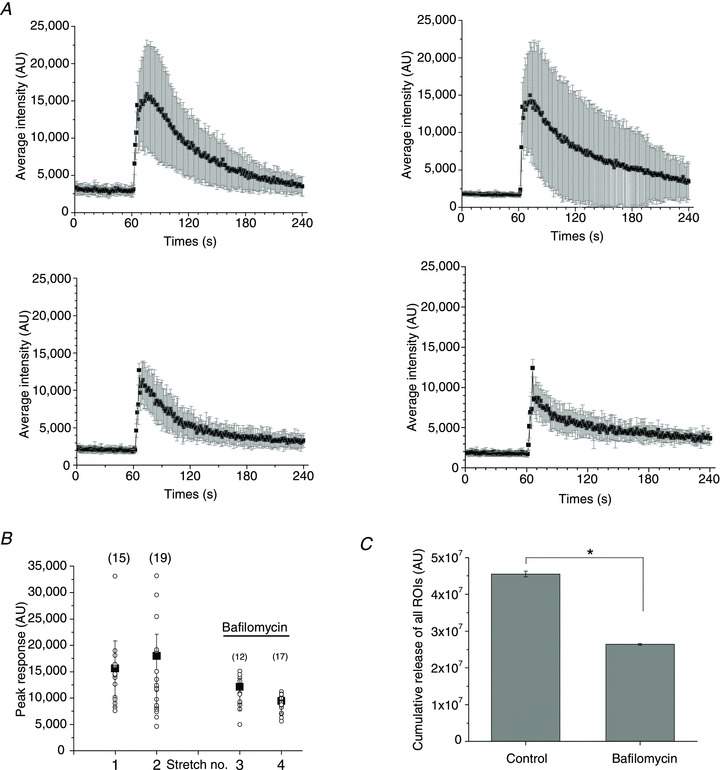
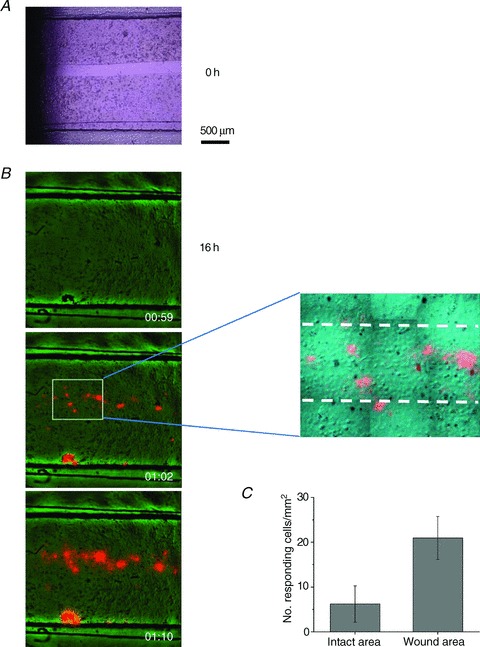
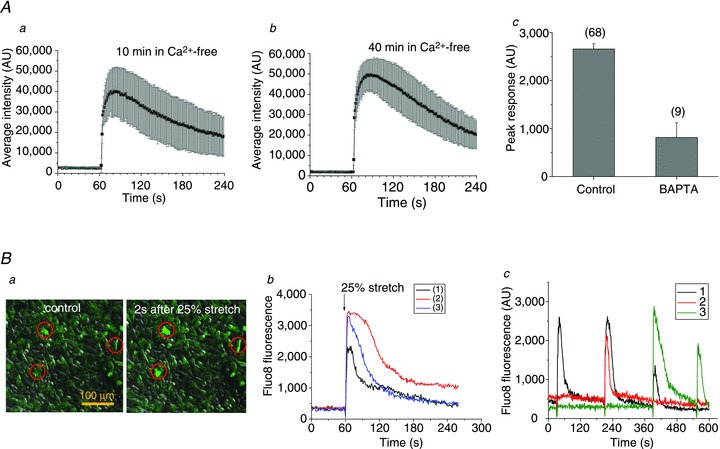
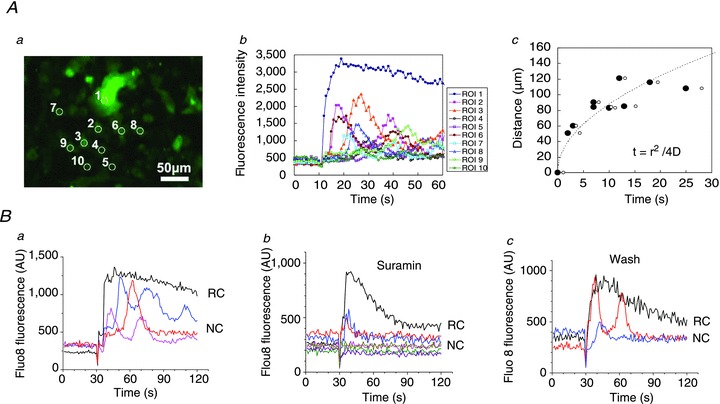
Abstract Mechano-transduction at cellular and tissue levels often involves ATP release and activation of the purinergic signalling cascade. In the lungs, stretch is an important physical stimulus but its impact on ATP release, the underlying release mechanisms and transduction pathways are poorly understood. Here, we investigated the effect of unidirectional stretch on ATP release from human alveolar A549 cells by real-time luciferin-luciferase bioluminescence imaging coupled with simultaneous infrared imaging, to monitor the extent of cell stretch and to identify ATP releasing cells. In subconfluent (<90%) cell cultures, single 1 s stretch (10-40%)-induced transient ATP release from a small fraction (1.5%) of cells that grew in number dose-dependently with increasing extent of stretch. ATP concentration in the proximity (150 μm) of releasing cells often exceeded 10 μm, sufficient for autocrine/paracrine purinoreceptor stimulation of neighbouring cells. ATP release responses were insensitive to the putative ATP channel blockers carbenoxolone and 5-nitro-2-(3-phenylpropyl-amino) benzoic acid, but were inhibited by N-ethylmaleimide and bafilomycin. In confluent cell cultures, the maximal fraction of responding cells dropped to <0.2%, but was enhanced several-fold in the wound/scratch area after it was repopulated by new cells during the healing process. Fluo8 fluorescence experiments revealed two types of stretch-induced intracellular Ca(2+) responses, rapid sustained Ca(2+) elevations in a limited number of cells and delayed secondary responses in neighbouring cells, seen as Ca(2+) waves whose propagation was consistent with extracellular diffusion of released ATP. Our experiments revealed that a single >10% stretch was sufficient to initiate intercellular purinergic signalling in alveolar cells, which may contribute to the regulation of surfactant secretion and wound healing.


Figures

Figure 1
Figure 1. Calibration of the ATP imaging system
A, example of luminescence responses to 1 μm ATP ejections of increasing durations of 1, 2, 3, 4 and 5 s (indicated in the upper right corner). Images were captured at the peak of the luminescence response. B, full-time course of the responses is illustrated; 5 s ejection was repeated after moving the pipette tip to a different location in the chamber to assure reproducibility of the response, shown as a grey trace. C, dose–response relationship between 1 μm ATP standard ejection time and peak luminescence (the graph includes data reported in B). The solid curve represents a fit with sigmoid function by Origin Lab, v. 7.5. D, calibration curve showing steady-state luminescence (in AU) for different ATP standards, obtained with the same experimental approach as in A–C. Calibration of the imaging system was performed separately with 4× and 20× objectives.
Figure 2
Figure 2. Stretch-induced ATP release sites are single cells
A, typical stretch-induced ATP release from A549 cell culture recorded at low magnification with 4× objective. Pictures in the panel reveal sequential overlay of luminescence (orange) and IR images (green) of the stretch chamber with cells growing in the 2 mm wide groove. Images were taken before, during and after 1 s stretch of 21%, at the elapsed times (min:s) indicated in the lower right corner. Note the displacement of chamber groove edges during stretch (elapsed time 01:00 versus 01:01), flagged by arrows. ATP-dependent luciferase luminescence is seen at several discrete sites of cell culture after stretch, although some responses are already detectable during 1 s stretch. B, stretch-induced ATP release recorded at higher magnification with 20× objective. The image overlay (green, differential interference contrast IR image; orange, ATP-dependent luminescence) reveals that ATP is released from single cells (indicated by arrows). The image was taken 3 s after a 25% stretch.
Figure 3
Figure 3. Time course of ATP release from A549 cells after a single stretch
A, sequence of images showing ATP-dependent luminescence at different time points after 37% stretch of 1 s duration applied at 60 s. The experiment elapsed time (in seconds) is indicated in the lower right corner. A pseudo-colour scale of ATP concentration is shown on the lower right. Note the multiple ATP release sites and high (micromolar) ATP concentrations in their vicinity. The images disclose the cell culture area of approximately 3 × 2 mm. B, time course of local luminescence intensities at 37 release sites seen in A. Their average (±s.d.) is reported in C. Note the dual scale: luminescence intensity (left) and ATP concentration (right).
Figure 4
Figure 4. Peak amplitude and duration of ATP release from single cells
A, stretch-induced ATP release responses from individual cells observed in the Fig. 3 experiment were grouped according to peak amplitude and duration (see text for more details): panel a, high-peak (>1 μm) and long-duration responses (six of 37); panel b, high-peak and short-duration responses (14 of 37); panel c, low-peak responses (<1 μm, 17 of 37); panel d, peak amplitude histogram of all responses grouped into two categories: high-peak responses (ROI 1–20) and low-peak responses (ROI 21–37). Solid black squares indicate average peak amplitude (±s.d.) for the two groups; statistically, they were significantly different at P < 0.05 (two-sample t test). B, ATP release duration analysis. Two examples, one of long and one of short release responses, are shown as black traces on the left in panels a and b respectively. Red traces represent the same traces after smoothing the data with Origin Lab software. On the right of each trace are shown the first time derivative of responses, calculated with Origin Lab software without smoothing (black line) and with previous smoothing of the data (red line). Arrows indicate the derivative maximum and minimum, which correspond to the time when ATP release started and ended respectively. For the examples reported here, they were at 63 s and 95 s for long-duration release, and 61 s and 71 s for short-duration release. Panel c represents a histogram of ATP release periods of all 37 responses observed in this experiment, where they are separated into two groups of short and long duration (see text for more explanations). Black squares and error bars indicate the average ±s.d. for each group. The two groups were statistically different at P < 0.05 (two-sample t test). ROI, region of interest.
Figure 5
Figure 5. ATP release responses to multiple stretches
A, colour-coded responses to repeated stretches of the same magnitude (29%) separated by 30 min recovery. A sequence of four stretches was applied but, for clarity, only ATP release responses to the first three stretches are shown. Note that different groups of cells responded to each stretch stimulation. B, time course of ATP release responses to repeated stimulation. The data are from the same experiment reported in A, and each graph is the average (±s.d.) of ATP-dependent luminescence from all active sites after stretch. The sequential stretch number and its extent are indicated in the graphs. C, peak ATP release responses to repetitive stimulation in the experiment appearing in A and B. For each stretch, the symbol ○ represents peak ATP release from individual sites, and ▪ is the average ±s.d. for all responding sites (their numbers are indicated in parentheses). D, the number of responding cells decreased gradually from 30 for the first stretch to 15 for the fourth stretch, but increased to 29 when the amplitude of the fifth stretch was augmented to 36%.
Figure 6
Figure 6. The number of responding cells grew with the extent of stretch
A, the graph shows the number of cells releasing ATP after a single 1 s stretch of different amplitudes. Cumulative data from 48 experiments with 24 cell cultures, performed at low magnification (4× objective) with typically 2000–3000 cells in the field of view. The graph also includes data from the same cell cultures subjected to sequential stretches of increasing amplitude. ○, control; ▴, presence of the anion channel inhibitor 5-nitro-2-(3-phenylpropyl-amino) benzoic acid (100 μm); ▪, presence of the pannexin channel inhibitor carbenoxolone (100 μm). The continuous line represents Gaussian fit to the data. B, average number of cells (±s.d.) responding to a sequence of four stretches of increasing amplitude. This stretch protocol was used typically when testing the effect of putative ATP release inhibitors. Horizontal error bars indicate the s.d. of average stretch in each group of the sequential stretch protocol, and the number of stretches in each group is indicated in parentheses.
Figure 7
Figure 7. Effect of CBX on ATP release
A, average (±s.d.) time course of ATP release from all responding sites induced by 22% stretch under control conditions, and 30 min later in response to 28% stretch in the presence of 100 μm CBX (left and right graphs respectively). B, peak ATP release responses from all active sites in the absence and presence of CBX. The data are from the same experiment as in A. For each stretch, the symbol ○ represents peak ATP release from individual release sites, and ▪ is the average ±s.d. for all responding sites. The data are representative of n= 10 experiments with five different cell cultures in the presence of 100 μm CBX. CBX, carbenoxolone.
Figure 8
Figure 8. Effect of NEM on ATP release
A, average (±s.d.) time course of ATP release from all responding sites under control conditions (left) and after treatment with 1 mm NEM for 30 and 60 min (centre and right graphs respectively). B, peak ATP release responses before and after NEM treatment. The data are from the same experiment as in A. For each stretch, the symbol ○ represents peak ATP release from individual release sites, and ▪ is the average ±s.d. for all responding sites (their number is indicated in parentheses). C, cumulative stretch-induced ATP release for all responding sites observed under control conditions and after 30 and 60 min of NEM treatment. Data are the average ±s.d. for the experiments in A and B. They are representative of n= 13 stretches in the presence of NEM with six different cell cultures. NEM, N-ethylmaleimide.
Figure 9
Figure 9. Effect of bafilomycin on ATP release
A, average (±s.d.) time course of ATP release from all responding sites under control conditions (two upper graphs) and after treatment with 5 μm bafilomycin for 30 and 60 min (left and right lower graphs respectively). The number of responding cells were similar for the two stretches under control conditions (15 and 19), compared to those observed in the presence of bafilomycin (12 and 17). B, peak ATP release responses before and after bafilomycin treatment. The data are from the same experiment as in A. For each stretch, the symbol ○ represents peak ATP release from individual release sites, and ▪ is the average ±s.d. for all responding sites (their number is indicated in parentheses). C, cumulative stretch-induced ATP release from all responding sites under control conditions and after treatment with bafilomycin. Data are the average ±s.d. of the experiments in A and B. They are representative of n= 6 stretches in the presence of bafilomycin with three different cell cultures. *Statistically significant difference (P < 0.05, two-sample t test).
Figure 10
Figure 10. Enhanced ATP release responses during wound healing
A, a ∼200 μm wide gap was created in a 2-day-old, fully confluent cell monolayer (t= 0) by removing a silicone strip that was attached to the bottom of the stretch chamber during cell seeding. The bright field image was taken with an inverted Nikon microscope, 20× objective. B, example of stretch-induced ATP release responses observed with cell cultures such as that appearing in A, after 16 h, when it was repopulated by new cells. The overlay of ATP-dependent luminescence (orange) and IR images (green) of cells in the stretch chamber are shown before stimulation, and 2 s and 10 s after 28% stretch. Note that almost all responses were within the wound-healing area, except for one artefact at the lower edge of the chamber, where some cells were agitated by debris visible in this spot on the image before stretch. The latter was excluded from the analysis. The zoomed region of the middle image discloses the ∼200 μm wide wound area, indicated by broken lines. Note that cells in the wound area are more spread out and flat compared to densely packed cells in the intact area, i.e. outside the broken lines. C, number of responding cells per mm2 in the wound-healing area was significantly enhanced when compared to the intact part of the same cell culture (P < 0.05, two-sample t test). Data are the average of five experiments/stretches with three different cell cultures.
Figure 11
Figure 11. Role of Ca2+ in stretch-induced ATP release
Aa and b show the average (±s.d.) time course of ATP release from all responding cells induced by stretch applied 10 min and 40 min, respectively, after removal of extracellular Ca2+. The two stretches were of 26% and 31% and the corresponding number of ATP releasing cells was 17 and 28. The responses were not different from those observed in the presence of extracellular Ca2+ (see Fig. 3). c, effect of a Ca2+ chelator BAPTA on stretch-induced ATP release. The graph shows average (±s.e.m.) of peak ATP release in control and BAPTA-loaded cells, and the number of responding cells appears in parentheses. Cells were loaded with 30 μm BAPTA-AM (80 min, 37°C). Ba, Fluo8 fluorescence and DIC overlay images of A549 cells in a stretch chamber before (control) and 2 s after 25% stretch, in left and right images respectively. The stretch-induced [Ca2+]i elevations seen as fluorescence increase in cells marked by red circles. b, example of time course of [Ca2+]i changes, recorded as Fluo8 fluorescence intensity, in three A549 cells, shown in a, that responded to single stretch. Stretch was applied at 60 s (indicated by the arrow). c, time course of [Ca2+]i responses to repetitive stimulation reported as Fluo8 fluorescence in three different cells in the field of view (indicated by black, green and red traces). A sequence of four stretches (28%, 34%, 34% and 39%) was applied at 30, 210, 390 and 550 s.
Figure 12
Figure 12. Ca2+ wave propagation induced by single stretch
Aa, [Ca2+]i responses, reported as Fluo8 fluorescence, in A549 cells after 28% stretch. The [Ca2+]i response was first triggered in cell 1; after a short delay, it propagated to neighbouring cells flagged by numbers 2–10. The image is an average of 30 sequential images taken during 30 s after stretch. b, time course of stretch-induced [Ca2+]i responses in cells 1–10 shown in a. Note the two types of responses: rapid and sustained [Ca2+]i response in cell 1 (primary response, black trace), and delayed, often oscillatory responses (secondary responses) in cells 2–8 (coloured traces). c, time-dependent propagation of Ca2+ wave. For each cell, the time when [Ca2+]i started to rise (filled circles) and the time of half-maximum [Ca2+]i responses (open circles) were plotted against the distance from cell 1 (region of interest 1). The broken line represents a fit to data points of the diffusion equation t=r2/4D, where r is distance from the source, t is time of the response at position r, and D is the diffusion constant. Here, from the fitted curve, D= 192 μm2 s−1. Ba, under control conditions, rapid and sustained [Ca2+]i elevation in a stretch-responding cell (RC, black trace) was followed by a number of delayed and oscillatory [Ca2+]i responses in neighbouring cells (NC, coloured traces) located up to ∼100 μm from the RC, 25% stretch. b, in the presence of 1 mm suramin, only cells directly adjacent to the stretch-responding cell showed a weak response, but no oscillations and no responses were observed in more distant cells, 30% stretch. c, the inhibitory effect of suramin was reversible. After washing, delayed [Ca2+]i responses in distant cells and oscillatory responses could again be seen, 40% stretch.

Similar articles

Cited by

References

    1. Abbracchio MP, Burnstock G, Verkhratsky A, Zimmermann H. Purinergic signalling in the nervous system: an overview. Trends Neurosci. 2009;32:19–29. - PubMed
    1. Adamson IY, Bowden DH. Derivation of type 1 epithelium from type 2 cells in the developing rat lung. Lab Invest. 1975;32:736–745. - PubMed
    1. Akopova I, Tatur S, Grygorczyk M, Luchowski R, Gryczynski I, Gryczynski Z, Borejdo J, Grygorczyk R. Imaging exocytosis of ATP-containing vesicles with TIRF microscopy in lung epithelial A549 cells. Purinergic Signal. 2012;8:59–70. - PMC - PubMed
    1. Bennett MR, Farnell L, Gibson WG. Quantal transmission at purinergic synapses: stochastic interaction between ATP and its receptors. J Theor Biol. 1995;175:397–404. - PubMed
    1. Boudreault F, Grygorczyk R. Cell swelling-induced ATP release is tightly dependent on intracellular calcium elevations. J Physiol. 2004;561:499–513. - PMC - PubMed

Publication types

MeSH terms

Substances