Comparative Study
. 2013 Mar 1;591(5):1347-71.
doi: 10.1113/jphysiol.2012.246546. Epub 2012 Dec 17.

Age-dependent chloride channel expression in skeletal muscle fibres of normal and HSA(LR) myotonic mice

Affiliations
Comparative Study

Age-dependent chloride channel expression in skeletal muscle fibres of normal and HSA(LR) myotonic mice

Marino DiFranco et al. J Physiol. .

Abstract

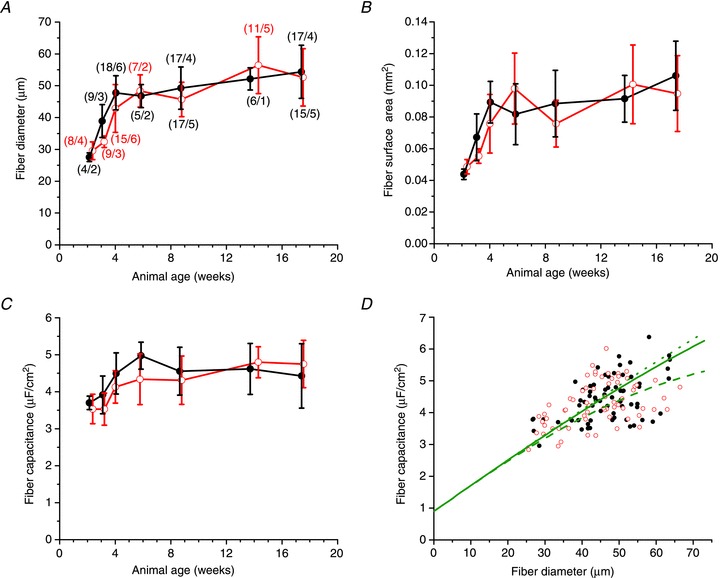
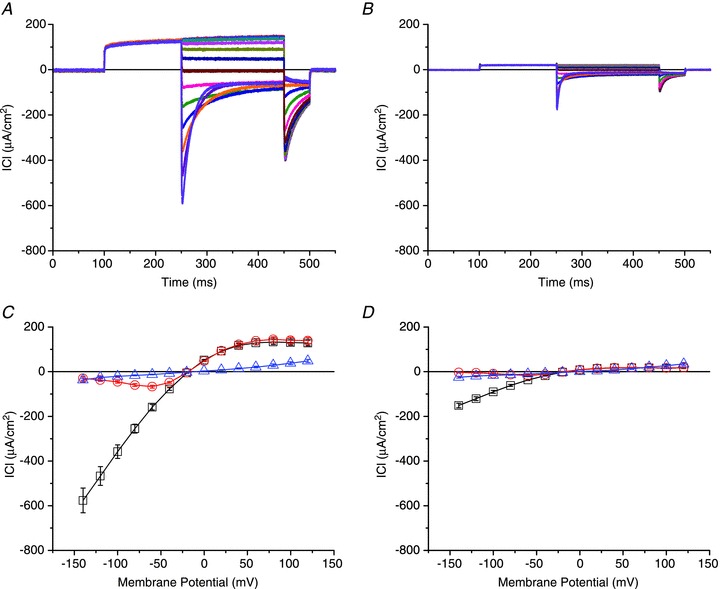
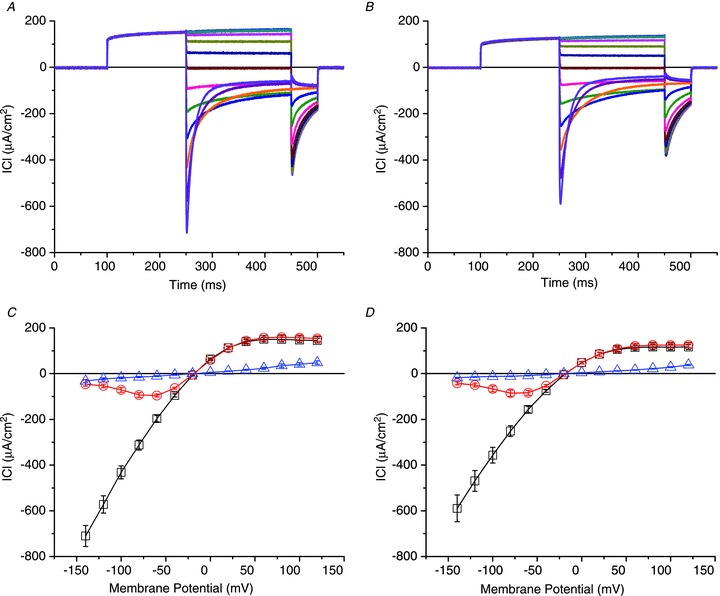
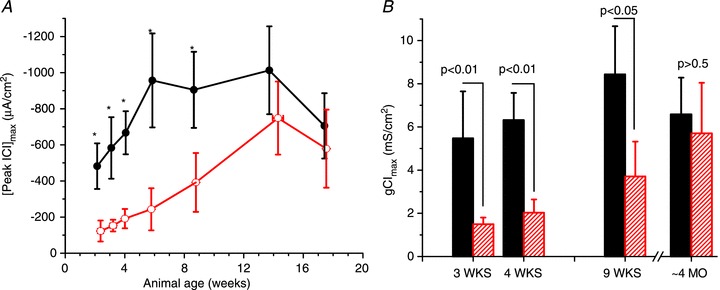
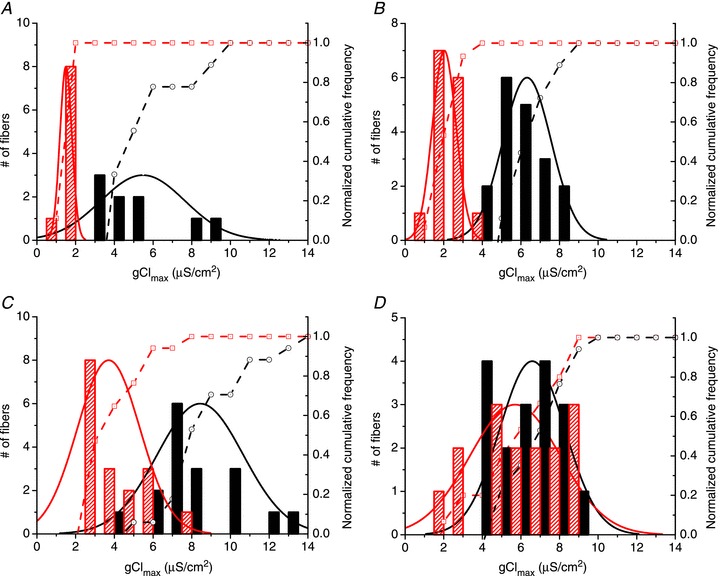
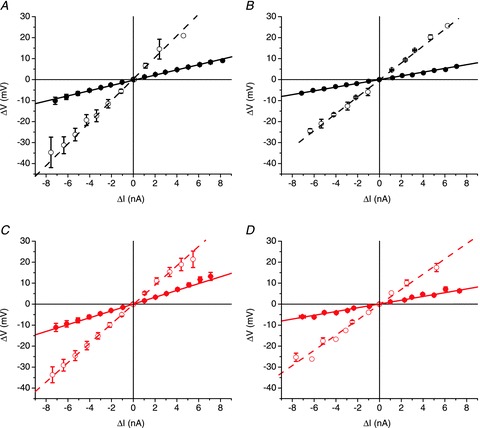
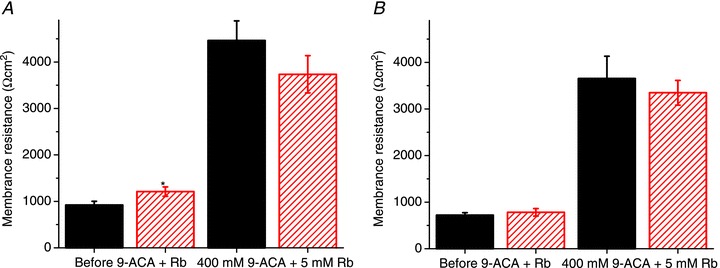
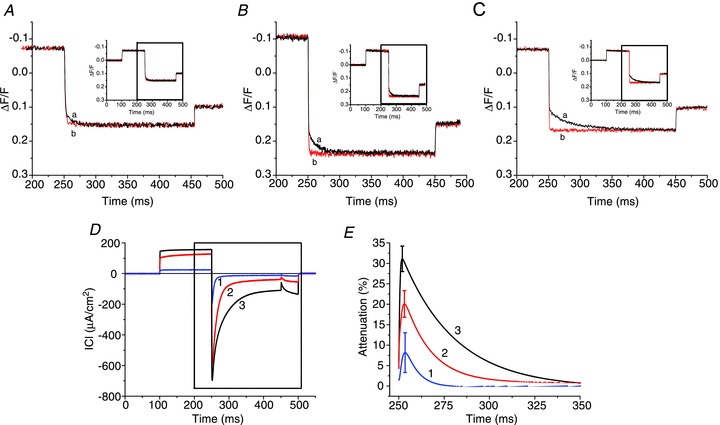
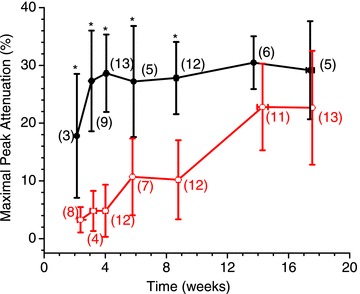
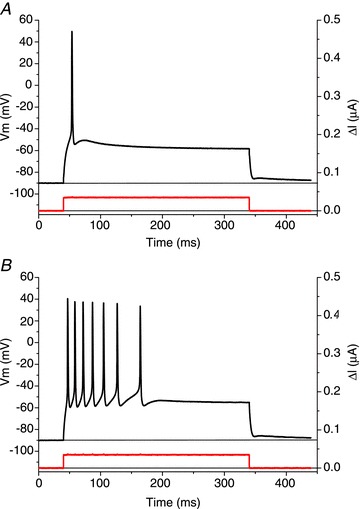
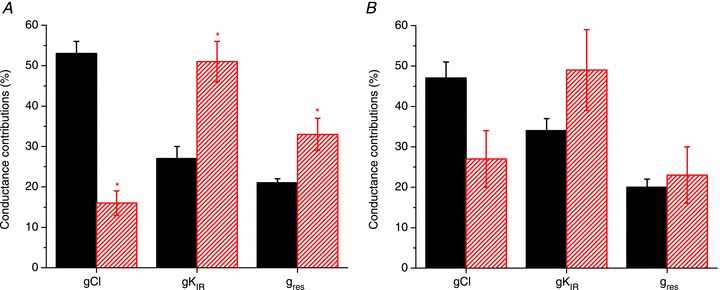
Abstract We combine electrophysiological and optical techniques to investigate the role that the expression of chloride channels (ClC-1) plays on the age-dependent electrical properties of mammalian muscle fibres. To this end, we comparatively evaluate the magnitude and voltage dependence of chloride currents (ICl), as well as the resting resistance, in fibres isolated from control and human skeletal actin (HSA)(LR) mice (a model of myotonic dystrophy) of various ages. In control mice, the maximal peak chloride current ([peak-ICl]max) increases from -583 ± 126 to -956 ± 260 μA cm(-2) (mean ± SD) between 3 and 6 weeks old. Instead, in 3-week-old HSA(LR) mice, ICl are significantly smaller (-153 ± 33 μA cm(-2)) than in control mice, but after a long period of ∼14 weeks they reach statistically comparable values. Thus, the severe ClC-1 channelopathy in young HSA(LR) animals is slowly reversed with aging. Frequency histograms of the maximal chloride conductance (gCl,max) in fibres of young HSA(LR) animals are narrow and centred in low values; alternatively, those from older animals show broad distributions, centred at larger gCl,max values, compatible with mosaic expressions of ClC-1 channels. In fibres of both animal strains, optical data confirm the age-dependent increase in gCl, and additionally suggest that ClC-1 channels are evenly distributed between the sarcolemma and transverse tubular system membranes. Although gCl is significantly depressed in fibres of young HSA(LR) mice, the resting membrane resistance (Rm) at -90 mV is only slightly larger than in control mice due to upregulation of a Rb-sensitive resting conductance (gK,IR). In adult animals, differences in Rm are negligible between fibres of both strains, and the contributions of gCl and gK,IR are less altered in HSA(LR) animals. We surmise that while hyperexcitability in young HSA(LR) mice can be readily explained on the basis of reduced gCl, myotonia in adult HSA(LR) animals may be explained on the basis of a mosaic expression of ClC-1 channels in different fibres and/or on alterations of other conductances.


Figures

Figure 1
Figure 1. Age dependence of muscle fibre parameters
Variation of fibre diameter (A), surface area (B) and specific capacitance (C) with age in control (filled circles) and HSALR fibres (open circles). Data (mean ± SD) are connected with line segments. The numbers in parentheses in (A) represent the number of fibres/animals used to obtain each data point; these numbers apply to the data in the four panels. D, membrane capacitance (Cm) plotted as a function of fibre diameter for FVB (filled circles) and HSALR mice (open circles). The linear traces correspond to theoretical predictions of the fibre's capacitance taking into account the TTS contribution (radial cable model) according to eqns (B12) and (B13) in section B of the Appendix while using the parameters in Table B1 and sarcolemma resistance (RS) values of 3000, 10,000 and 20,000 Ω cm2 (dashed, continuous and dotted traces, respectively). As will be shown later in the paper (see Table 1), the capacitance values in this figure span the entire range seen experimentally.
Figure 2
Figure 2. Chloride currents (ICl) from young transgenic and control fibres
Currents elicited by the three-pulse protocol in 3-week-old control (A and C) and HSALR (B and D) fibres. A and B, families of 9-ACA-sensitive currents (ICl) from a control and a HSALR, respectively. The maximal peak ICl, capacitance, length and diameter for the FVB and HSALR fibres were: −586 and −166 μA cm−2; 4.23 and 4.24 μF cm−2; 496 and 547 μm; 39 and 31 μm, respectively. C and D, the voltage dependence of peak (open squares) and steady-state values (open circles) of 9-ACA-sensitive currents for the FVB and HSALR fibres. The steady-state values of the 9-ACA-insensitive currents are plotted as open triangles. Data in C and D were obtained from nine FVB fibres (continuous) and nine HSALR fibres (three mice). Data in C and D (means ± SEM) are connected by line segments.
Figure 3
Figure 3. Chloride currents (ICl) from young adult FVB and HSALR mice
Currents recorded from 17-week-old control (A and C) and HSALR (B and D) fibres in response to the three-pulse protocol. A and B, family of 9-ACA-sensitive currents from a control and a HSALR, respectively. The maximal peak ICl, capacitance, length and diameter for the FVB and HSALR fibres were: −715 and −588 μA cm−2; 4.26 and 4.17 μF cm−2; 588 and 494 μm; 53 and 49 μm, respectively. C and D, the voltage dependence of peak (open squares) and steady-state values (open circles) of 9-ACA-sensitive currents for the two populations of FVB and HSALR fibres, respectively. The steady-state values of the 9-ACA-insensitive currents are represented by the open triangles. Data in C and D were obtained from 17 FVB fibres (four mice) and 15 HSALR fibres (five mice), respectively. Data in C and D (mean ± SEM) are connected by line segments.
Figure 4
Figure 4. Age dependence of maximum peak chloride current ([peak ICl]max) and maximum slope chloride conductance (gCl,max)
A, average peak ICl determined at −140 mV from FVB (filled circles) and HSALR (open circles) fibres isolated from 2–17-week-old mice. The error bars represent the SD; the asterisks indicate statistical significance (P < 0.05). B, the maximum slope chloride conductance was determined (as described in the text) from IV plots obtained from control (filled bars) and HSALR (hatched bars) fibres. The error bars represent the SD; the numbers indicate significance level. The number of fibres/animals used for each age and strain are the same as in Fig. 1A.
Figure 5
Figure 5. Frequency histograms of maximal slope chloride conductances (gCl,max) obtained from FVB and HSALR fibres isolated from mice of various ages
The maximal slope conductance of FVB (filled bars) and HSALR (hatched bars) fibres isolated from 3-, 4-, 9- and 17-week-old mice are shown in A, B, C and D, respectively. The plots are fitted with normal distributions to the FVB and HSALR data (continuous lines). The dashed lines connect the cumulative distribution data points for FVB (open circles) and HSALR mice (open squares), normalized to the number of fibres of each strain and age group. The average maximal slope conductances for 3-, 4-, 9- and 17-week-old FVB mice were: 5.5, 6.3, 8.4 and 6.6 mS cm−2, respectively. The average maximal slope conductances for 3-, 4-, 9- and 17-week-old HSALR mice were: 1.5, 2.0, 3.7 and 5.7 mS cm−2, respectively. The number of fibres/animals used for each age and strain are the same as in Fig. 1A.
Figure 6
Figure 6. Voltage–current relationship for young and old FVB and HSALR mice
AD, plots of the steady-state displacement of membrane potential (ΔVm) in response to current injection (ΔI) for FVB (A and B) and HSALR (C and D). Data for 3- and 17-week-old mice are shown in A and C, and B and D, respectively. The filled symbols represent the responses obtained in the presence of Tyrode, and the open symbols are the responses measured in the presence of 400 mm 9-ACA and 5 mm Rb. All solutions contained 400 nm TTX. The lines are linear regression of the data in the presence of Tyrode (continuous lines) or Tyrode with 9-ACA and Rb (dashed lines). The slopes for FVB fibres are: 1237 (n = 9), 5153 (n = 9), 982 (n = 9) and 4030 (n = 9) kΩ for 4 weeks/Tyrode, 4 weeks/9-ACA + Rb, 17 weeks/Tyrode and 17 weeks/9-ACA + Rb, respectively. The slopes for HSALR fibres are: 1626 (n = 9), 4614 (n = 9), 900 (n = 9) and 3630 (n = 9) kΩ for 4 weeks/Tyrode, 4 weeks/9-ACA + Rb, 17 weeks/Tyrode and 17 weeks/9-ACA + Rb, respectively. Data are mean ± SEM.
Figure 7
Figure 7. Membrane resistance in fibres from young and adult FVB and HSALR mice
A, average membrane resistance from FVB (filled bars) and HSALR (hatched bars) isolated from 4-week-old mice. Data obtained in the presence of Tyrode or Tyrode added with 9-anthracene-carboxilic acid (9-ACA; 400 mm) and Rb (5 mm) are presented by filled and dashed colours, respectively. B, average membrane resistance from FVB (filled bars) and HSALR (hatched bars) isolated from 4-month-old mice. Data obtained in the presence of Tyrode or Tyrode added with 9-ACA (400 mm) and Rb (5 mm) are presented by filled and dashed bars, respectively. All data in experiments in A and B were collected in the presence of TTX (400 nm). In A and B, the error lines are the SEM.
Figure 8
Figure 8. Current-dependent attenuation of TTS membrane potential in young and adult FVB and HSALR fibres
AC, optical measurement of TTS membrane potential changes in response to a hyperpolarization to −140 mV. The fibres in A and B were isolated from 4- and 17-week-old HSALR mice, respectively. The data in C were obtained from a fibre isolated from a 4-month-old FVB mouse. The traces labelled a and b are the responses to the second pulse of the three-pulse protocol before and after blocking chloride current (ICl; 400 μm 9-ACA), respectively. The insets show the complete record of TTS signals in response to the three-pulse protocol. The rectangles in the insets indicate the part of the records shown in AC. D, 9-ACA-sensitive ICl currents corresponding to the optical records (trace a) in AC (before blocking ICl). E, current-dependent attenuation calculated from the data in AC. The traces labelled 1, 2 and 3 represent the data from fibres from 4-week-old HSALR (A), 17-week-old HSALR (B) and 17-week-old FVB mice (C), respectively. The error lines indicate the uncertainty in the calculation of the percentage of di-8-ANEPPS attenuation due to noise.
Figure 9
Figure 9. Age dependence of attenuation in FVB and HSALR mice
Data represent the average attenuation due to the ICl elicited by a hyperpolarization to −140 mV from control (filled circles) and HSALR (open circles) fibres isolated from 2–17-week-old mice. Data points (mean ± SD) are connected by lines segments. The numbers in parentheses indicate number of fibres; the asterisks indicate statistical significance.
Figure 10
Figure 10. Fibres from adult HSALR mice are more excitable than from age-matched FBV mice
The upper traces in A and B are voltage records acquired from FDB fibres of control and HSALR mice, respectively. The lower traces are the current pulses (50 nA, 300 ms). The records were obtained in Tyrode. The ages of the mice were 20 weeks and 17 weeks for A and B, respectively.
Figure 11
Figure 11. Conductance contributions to the resting gm in fibres from FVB and HSALR mice
The proportional contributions of gCl, gK,IR and gres to gm were calculated from Rm values obtained in fibres sequentially bathed in Tyrode, Tyrode + Rb, Tyrode + 9-ACA and Tyrode + Rb + 9-ACA. The specific experiments for these calculations are a subset of those used to calculate Rm values reported in Table 1 and Fig. 7. The percentage contributions of gCl, gK,IR and gres were calculated by algebraically solving the system of linear equations using Rm data under the four experimental conditions. A and B, the data from young and adult animals, respectively. The filled and hatched columns correspond to data from control and HSALR animals, respectively. The error bars represent the SEM. The asterisks show significance at P < 0.05.
Figure 12
Figure 12. Short cable equivalent circuit
A, equivalent circuit of a cable segment. B and C, details of circuit-equivalent circuit element without (B) and with (C) access resistance Ra.

Similar articles

Cited by

References

    1. Adrian RH, Bryant SH. On the repetitive discharge in myotonic muscle fibres. J Physiol. 1974;240:505–515. - PMC - PubMed
    1. Adrian RH, Chandler WK, Hodgkin AL. The kinetics of mechanical activation in frog muscle. J Physiol. 1969a;204:207–230. - PMC - PubMed
    1. Adrian RH, Costantin LL, Peachey LD. Radial spread of contraction in frog muscle fibres. J Physiol. 1969b;204:231–257. - PMC - PubMed
    1. Aromataris EC, Rychkov GY. ClC-1 chloride channel: matching its properties to a role in skeletal muscle. Clin Exp Pharmacol Physiol. 2006;33:1118–1123. - PubMed
    1. Ashcroft FM, Heiny JA, Vergara J. Inward rectification in the transverse tubular system of frog skeletal muscle studied with potentiometric dyes. J Physiol. 1985;359:269–291. - PMC - PubMed

Publication types

MeSH terms

LinkOut - more resources