. 2013 Jan 2;110(1):348-53.
doi: 10.1073/pnas.1213680110. Epub 2012 Dec 17.

Activation of 5-HT2A receptors upregulates the function of the neuronal K-Cl cotransporter KCC2

Affiliations

Activation of 5-HT2A receptors upregulates the function of the neuronal K-Cl cotransporter KCC2

Rémi Bos et al. Proc Natl Acad Sci U S A. .

Abstract

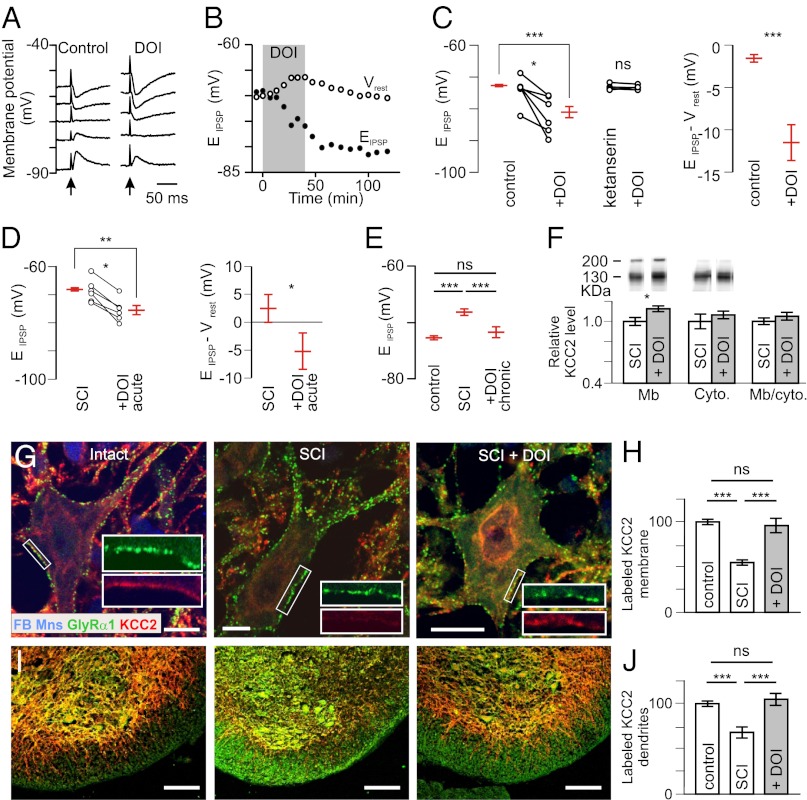
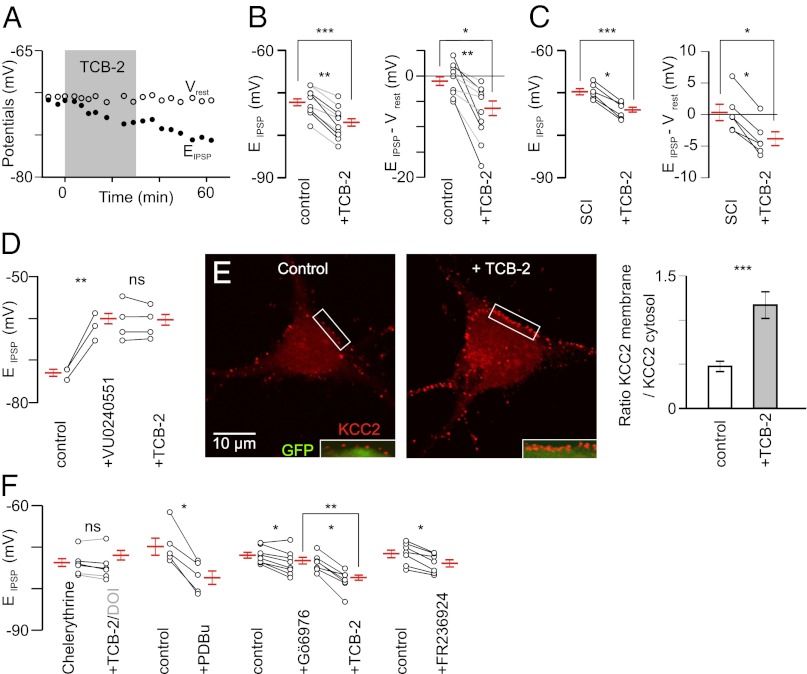
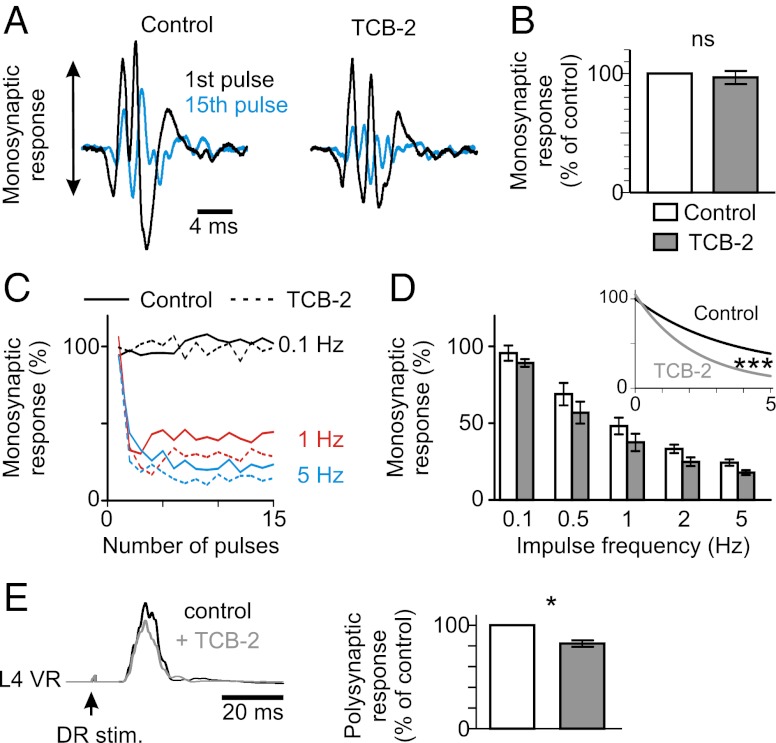
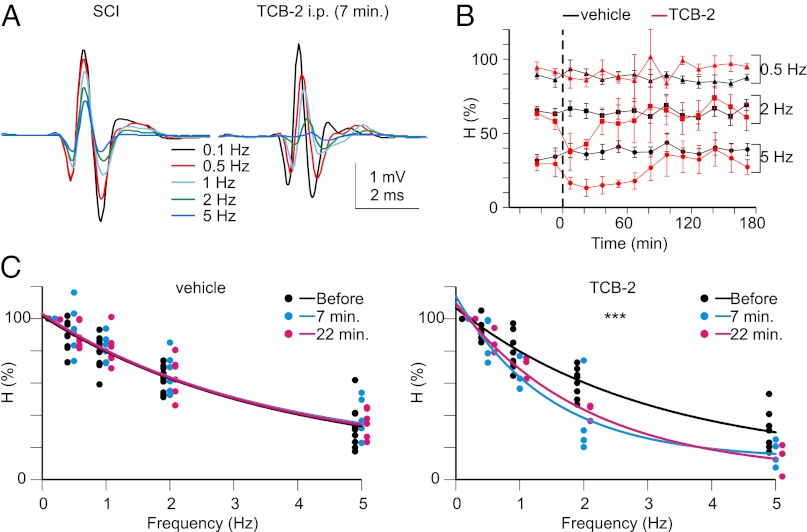
In healthy adults, activation of γ-aminobutyric acid (GABA)(A) and glycine receptors inhibits neurons as a result of low intracellular chloride concentration ([Cl(-)](i)), which is maintained by the potassium-chloride cotransporter KCC2. A reduction of KCC2 expression or function is implicated in the pathogenesis of several neurological disorders, including spasticity and chronic pain following spinal cord injury (SCI). Given the critical role of KCC2 in regulating the strength and robustness of inhibition, identifying tools that may increase KCC2 function and, hence, restore endogenous inhibition in pathological conditions is of particular importance. We show that activation of 5-hydroxytryptamine (5-HT) type 2A receptors to serotonin hyperpolarizes the reversal potential of inhibitory postsynaptic potentials (IPSPs), E(IPSP), in spinal motoneurons, increases the cell membrane expression of KCC2 and both restores endogenous inhibition and reduces spasticity after SCI in rats. Up-regulation of KCC2 function by targeting 5-HT(2A) receptors, therefore, has therapeutic potential in the treatment of neurological disorders involving altered chloride homeostasis. However, these receptors have been implicated in several psychiatric disorders, and their effects on pain processing are controversial, highlighting the need to further investigate the potential systemic effects of specific 5-HT(2A)R agonists, such as (4-bromo-3,6-dimethoxybenzocyclobuten-1-yl)methylamine hydrobromide (TCB-2).


Conflict of interest statement

The authors declare no conflict of interest.

Figures

Fig. 1.
Fig. 1.
Activation of 5-HT2Rs hyperpolarizes EIPSP and increases membrane expression of KCC2. (A) IPSPs evoked by stimulation of the ventral funiculus of the spinal cord (arrow) at different holding potentials in a motoneuron from a P6 intact rat before and after adding DOI (10 µM). (B) Time course of the change in EIPSP and Vrest. (C) EIPSP and driving force (EIPSP-Vrest) measured in control conditions (n = 21) and after adding DOI (n = 8). ***P < 0.001 (Mann–Whitney test). Six motoneurons were tested before and after DOI. *P < 0.05 (Wilcoxon paired test). The effects of DOI were prevented in the presence of ketanserin (10 µM; n = 4) (Center). (D) Effects of DOI (1–1.5 µM) on EIPSP and driving force in motoneurons recorded 4–6 d after neonatal SCI (17 and 6 cells recorded in the absence and the presence of DOI, respectively). **P < 0.01, *P < 0.05 (Mann–Whitney test); *P < 0.05 (Wilcoxon paired test). (E) EIPSP was significantly more hyperpolarized after chronic treatment of DOI (n = 9) compared with SCI animals (n = 22) but not different compared with control animals (n = 21). ns, not significant (P > 0.05); ***P < 0.001 (one-way ANOVA, Tukey’s post tests). (F, Upper) Western blots of membrane and cytoplasmic fractions of lumbar spinal cords labeled with a KCC2-specific antibody. The 130- to 140-kDa and the >200-kDa bands correspond to the monomeric and oligomeric proteins, respectively (53). (F, Lower) Quantification of KCC2 expression in DOI-treated rats after neonatal SCI (percentage of untreated rats). *P < 0.05 (Mann–Whitney test; n = 6 in each group). (G) Dual labeling of GlyRα1 and KCC2 on FB-labeled ankle extensor motoneurons, in three conditions (P7): intact, neonatal SCI, and chronic DOI treatment. (Scale bars: 10 µm.) (H) Quantification of the density of membrane KCC2 labeling (ratios of labeled pixel surface per somatic perimeter) in intact rats (n = 34 motoneurons) and untreated (n = 41) or DOI-treated (n = 44) rats with neonatal SCI (three rats in each group). ***P < 0.001 (Kruskal–Wallis test, Dunn’s post tests). (I) Ventral part of the lumbar spinal cord exhibiting KCC2-immunopositive dendrites stretching out through the white matter. (Scale bars: 100 µm.) (J) Quantification of the KCC2 labeling in the white matter in intact rats (n = 34) and untreated (n = 41) or DOI-treated (n = 44) rats with neonatal SCI. ***P < 0.001 (Kruskal–Wallis test, Dunn’s post tests).
Fig. 2.
Fig. 2.
Involvement of 5-HT2ARs via a PKC-dependent signaling pathway. (A) TCB-2 (0.1 µM; 30 min) induces a hyperpolarizing shift of EIPSP without concomitant effect on Vrest (P6). (B, Left) Effect of TCB-2 (0.1 µM, gray; 10 µM, black) on 10 motoneurons recorded from control rats (P5–P6). ***P < 0.001 (Mann–Whitney test; n = 12 and n = 14 before and under TCB-2, respectively); **P < 0.01 (Wilcoxon paired test). The difference was also significant when considering only the effect of the lowest concentration [0.1 µM; n = 6; *P < 0.05 (Wilcoxon paired test)]. (B, Right) Effect of TCB-2 (0.1–10 µM) on the driving force (control, n = 12; TCB-2, n = 14). *P < 0.05 (Mann–Whitney test); **P < 0.01 (Wilcoxon paired test). (C) Effect of TCB-2 (0.1 µM) on EIPSP and the driving force of motoneurons (six and nine in the absence and in the presence of TCB-2, respectively) in animals with SCI at birth. ***P < 0.001, *P < 0.05 (Mann–Whitney test); *P < 0.05 (Wilcoxon paired test) (n = 6). (D) EIPSP was significantly depolarized by the application of the KCC2 blocker VU0240551 (25 µM), which prevented the hyperpolarizing effect of TCB-2 (0.1 µM; n = 11). Averages are taken from 3 motoneurons in control situation, 9 motoneurons under VU0240551, and 11 motoneurons in the presence of both VU0240551 and TCB-2. ns, P > 0.05; **P < 0.01 (Mann–Whitney test). (E) TCB-2 (0.1 µM; 30 min) significantly increased the expression of KCC2 at the plasma membrane of Hb9::eGFP transgenic motoneurons in culture (14 DIV). (E, Left and Center) Merge images (Insets) show the KCC2 immunolabeling at the periphery of GFP-expressing cytosol. (E, Right) Ratio of KCC2 expression between plasma membrane and cytosol. ***P < 0.001 (t test; n = 34 cells from two experiments analyzed in each condition). (F) Preincubation of the PKC inhibitor chelerythrine (20 µM; 30 min; n = 6) prevented the effect of DOI (10 µM; n = 3; gray) or TCB-2 (0.1 µM; n = 3). PDBu significantly hyperpolarized EIPSP. ns, P > 0.05; *P < 0.05 (Wilcoxon paired test). The Ca2+-dependent PKC inhibitor Gö6976 (2 µM; n = 8) induced a slight but significant hyperpolarization of EIPSP and a further ∼4-mV negative shift was observed after adding TCB-2 (0.1 µM; n = 16). **P < 0.001 (Mann–Whitney test); *P < 0.05 (Wilcoxon paired test). The activator of the Ca2+-independent PKCɛ (FR236924; 2–8 µM; n = 7) hyperpolarized EIPSP. *P < 0.05 (Wilcoxon paired test).
Fig. 3.
Fig. 3.
Effects of TCB-2 on ventral root responses to dorsal root stimulation in the intact spinal cord in vitro. (A) Responses evoked in the L5 ventral root by supramaximal stimulation of the ipsilateral homonymous dorsal root, in the in vitro spinal cord isolated from rats at P6. The earliest component represents the monosynaptic response of motoneurons. The amplitude of this response decreased when the dorsal root was stimulated repeatedly (response to the 15th pulse at 1 Hz is shown in blue, superimposed with the control response to the first pulse). The slight increase in latency is attributable to a delayed firing of motoneurons as the pulse number increases. The amplitude of the response to the 15th pulse was much smaller after adding TCB-2 (0.1–0.15 µM). (B) Relative amplitudes of the monosynaptic responses delivered every 30 s before and 20–30 min after adding TCB-2 [percentage of control before TCB-2; P > 0.05 (Wilcoxon paired test); n = 12]. (C) Relative amplitudes of the monosynaptic responses to 15 consecutive stimulations at different frequencies (0.1 Hz, black; 1 Hz, red; 5 Hz, blue) before (continuous line) and after adding TCB-2 (dotted line). This is the same experiment as in A. (D) Mean (± SEM) relative amplitudes of the monosynaptic reflex at different stimulation frequencies in seven animals at P5–P6 before [controls in artificial cerebrospinal fluid (aCSF)] and after TCB-2 application (0.1–0.15 μM). Twelve values (the first three discarded) were averaged for each animal. The RDD was significantly increased by TCB-2. ***P < 0.001 (one-phase exponential decay regression). Note that for each frequency of stimulation, except at 0.1 Hz, the difference between before and after TCB-2 was significant [P < 0.05 (Wilcoxon paired test)]. (E) Mean envelopes of the ventral root (VR) burst evoked by stimulation of the ipsilateral homonymous dorsal root (DR) before and after adding TCB-2 (0.15 µM). *P < 0.05 (Wilcoxon paired test; n = 7).
Fig. 4.
Fig. 4.
Activation of 5-HT2ARs increases the RDD of the H reflex. (A) Hmax responses evoked in adult rats after SCI before (Left) and 7 min after i.p. injection of TCB-2 (0.3 mg/kg) (Right). Each trace is the mean response to 17 consecutive stimulations (the first three discarded) at 0.1, 0.5, 1, 2, or 5 Hz. (B) Time course of the change in H-reflex depression after i.p. injection of vehicle (NaCl; n = 6 rats) or TCB-2 (n = 4). (C) Mean relative amplitudes of the H reflex before (black) and after (blue, 7 min; red, 22 min) the injection of vehicle (Left) or TCB-2 (Right). The data of all experiments are represented (the dots that are slightly offset at each frequency of stimulation are for clarity) together with the one-phase exponential decay fit of these data. ***P < 0.001, comparison of the fits before and after TCB-2 (either 7 or 22 min). The fits before and after vehicle are not significantly different.

References

    1. Blaesse P, Airaksinen MS, Rivera C, Kaila K. Cation-chloride cotransporters and neuronal function. Neuron. 2009;61(6):820–838. - PubMed
    1. Payne JA, Stevenson TJ, Donaldson LF. Cation-chloride co-transporters in neuronal communication, development and trauma. J Biol Chem. 1996;271(27):16245–16252. - PubMed
    1. Payne JA, Rivera C, Voipio J, Kaila K. Molecular characterization of a putative K-Cl cotransporter in rat brain. A neuronal-specific isoform. Trends Neurosci. 2003;26(4):199–206. - PubMed
    1. Kahle KT, et al. Roles of the cation-chloride cotransporters in neurological disease. Nat Clin Pract Neurol. 2008;4(9):490–503. - PubMed
    1. Jean-Xavier C, Mentis GZ, O’Donovan MJ, Cattaert D, Vinay L. Dual personality of GABA/glycine-mediated depolarizations in immature spinal cord. Proc Natl Acad Sci USA. 2007;104(27):11477–11482. - PMC - PubMed

Publication types

MeSH terms