. 2013 Jan 2;110(1):187-92.
doi: 10.1073/pnas.1208863110. Epub 2012 Dec 17.

Regulation of neonatal and adult mammalian heart regeneration by the miR-15 family

Affiliations

Regulation of neonatal and adult mammalian heart regeneration by the miR-15 family

Enzo R Porrello et al. Proc Natl Acad Sci U S A. .

Abstract

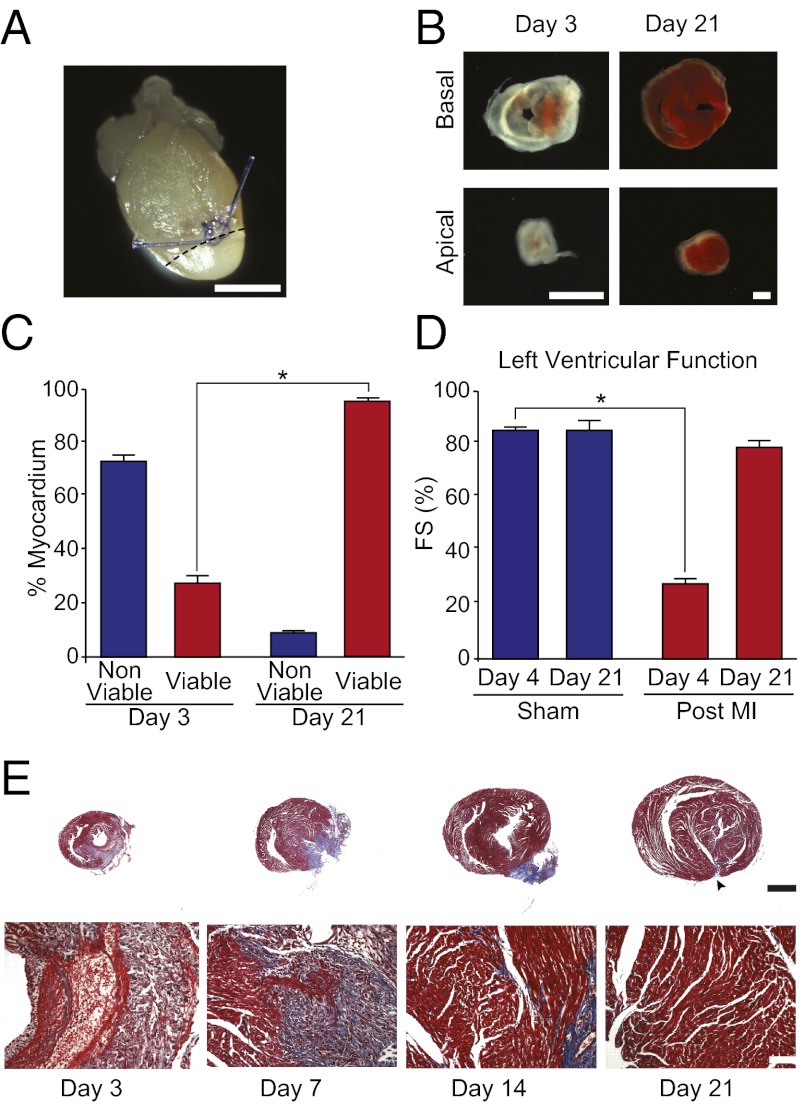
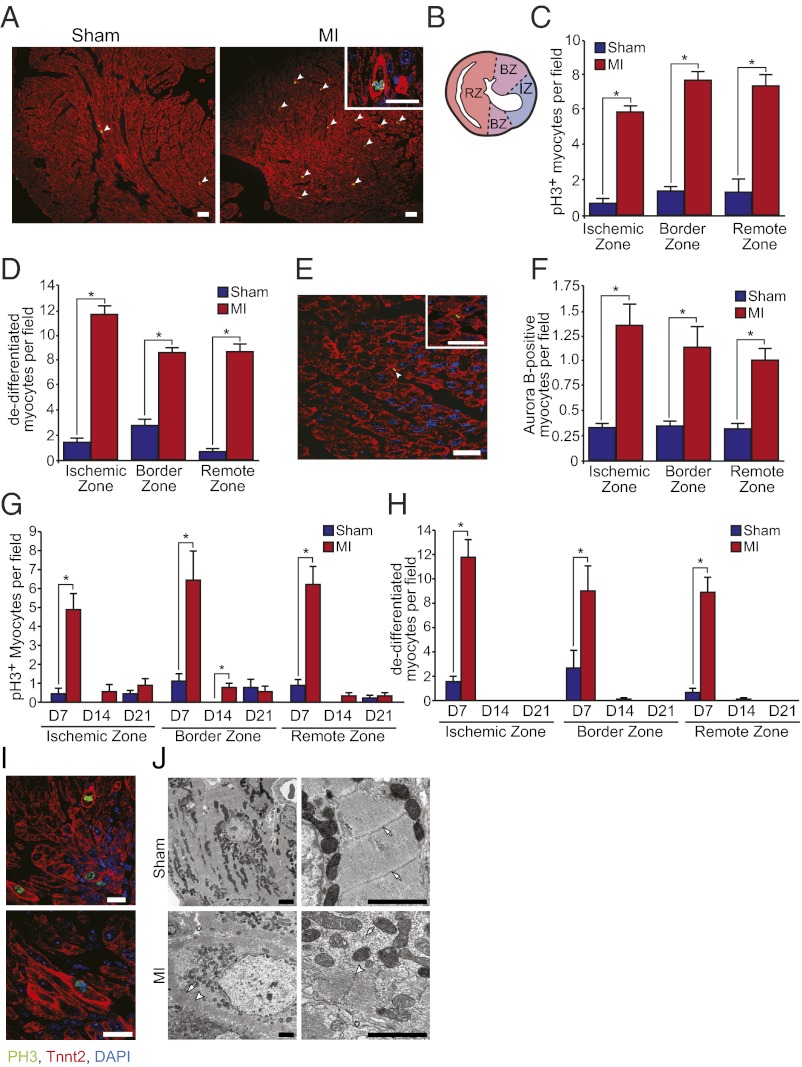
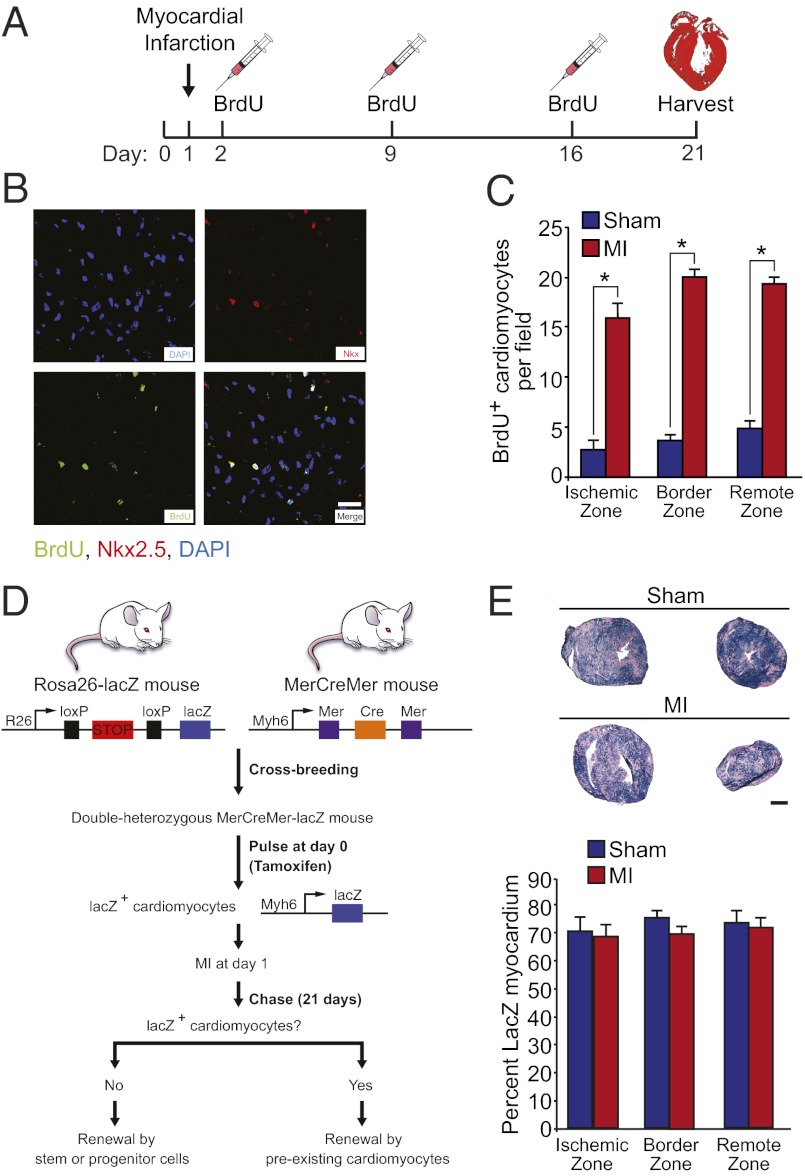
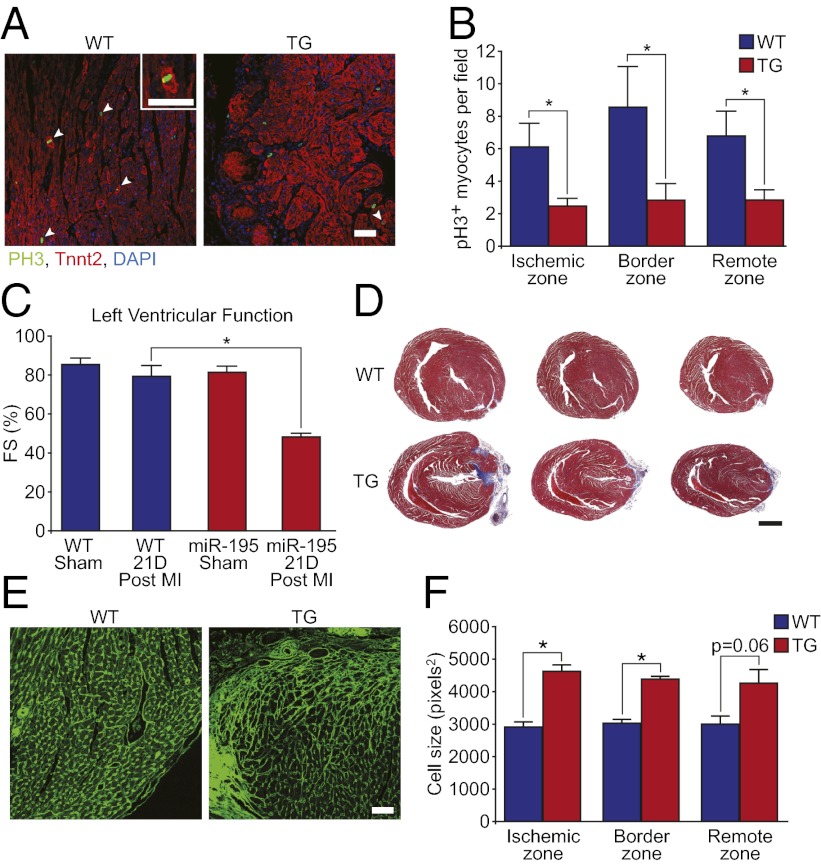
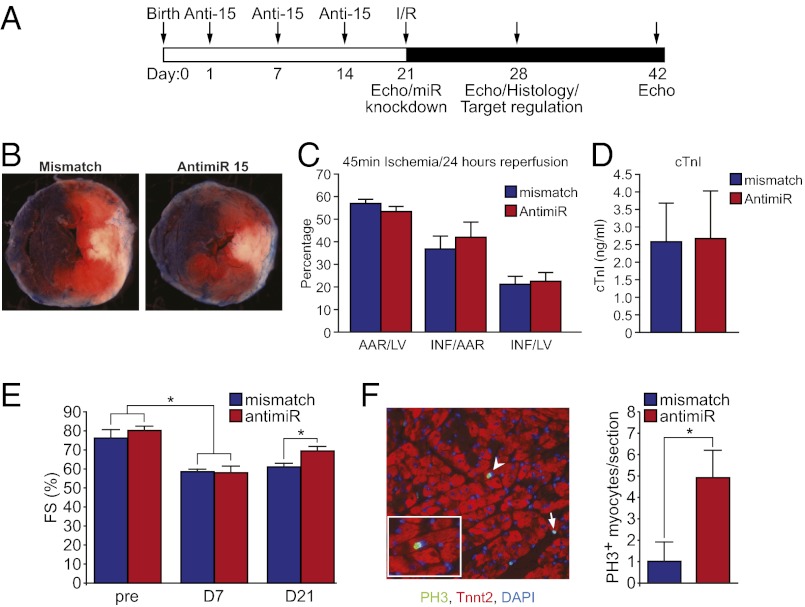
We recently identified a brief time period during postnatal development when the mammalian heart retains significant regenerative potential after amputation of the ventricular apex. However, one major unresolved question is whether the neonatal mouse heart can also regenerate in response to myocardial ischemia, the most common antecedent of heart failure in humans. Here, we induced ischemic myocardial infarction (MI) in 1-d-old mice and found that this results in extensive myocardial necrosis and systolic dysfunction. Remarkably, the neonatal heart mounted a robust regenerative response, through proliferation of preexisting cardiomyocytes, resulting in full functional recovery within 21 d. Moreover, we show that the miR-15 family of microRNAs modulates neonatal heart regeneration through inhibition of postnatal cardiomyocyte proliferation. Finally, we demonstrate that inhibition of the miR-15 family from an early postnatal age until adulthood increases myocyte proliferation in the adult heart and improves left ventricular systolic function after adult MI. We conclude that the neonatal mammalian heart can regenerate after myocardial infarction through proliferation of preexisting cardiomyocytes and that the miR-15 family contributes to postnatal loss of cardiac regenerative capacity.


Conflict of interest statement

Conflict of interest statement: E.N.O. is a cofounder of miRagen Therapeutics, a company focused on developing miRNA-based therapies for cardiovascular disease.

Figures

Fig. 1.
Fig. 1.
Neonatal heart regeneration after MI. (A) Whole-mount image of a neonatal heart 1 day after LAD ligation at P1. Note blanching of the territory supplied by the LAD (area below dashed line). (B) TTC staining below the ligature at day 3 and 21 after LAD ligation. Basal and apical sections are shown for each heart. Red staining indicates viable myocardium. (C) Quantification of TTC staining at day 3 and 21 after LAD ligation demonstrating recovery of myocardial viability by day 21 after injury. Quantification represents analysis of a total of ∼30 sections from four to five independent samples per group. (D) Left ventricular systolic function quantified by fractional shortening (FS) showing significant systolic dysfunction 4 d after MI, with restoration of normal systolic function by 21 d after MI. Values presented as means ± SEM; n = 3–5 per group; *P < 0.05. (E) Low magnification (Upper) and high magnification (Lower) Masson’s trichrome staining at multiple timepoints after MI. Note the extensive myocyte loss and inflammatory cell infiltration at 3 d after MI, followed by extracellular matrix deposition, then gradual restoration of normal anterior wall thickness by 21 d. There was little evidence of fibrosis at 21 d after MI, with the exception of a small region of fibrotic tissue at the site of the permanent ligature (arrowhead). (Scale bars: A, B, and E, 1 mm.)
Fig. 2.
Fig. 2.
Neonatal MI induces cardiomyocyte proliferation and dedifferentiation. (A) pH3 and troponin T staining of sham-operated and MI hearts at day 7 after surgery. Note the marked increase in pH3+ cardiomyocytes with disassembled sarcomeres (arrowheads). Inset shows a higher magnification view of a pH3+ cardiomyocyte with disorganized sarcomeric structure and intense troponin T staining around the periphery of the cell. (B) Cartoon depicting a transverse heart section after MI with ischemic, border, and remote zones used for quantification highlighted. (C and D) Quantification of the number of pH3+ cardiomyocytes and cardiomyocytes with disassembled sarcomeres at 7 d after MI. (E) Aurora B staining of a cardiomyocyte undergoing cytokinesis at day 7 after MI. (F) Quantification of the number of aurora B+ cardiomyocytes at 7 d after MI. (G) Quantification of cardiomyocyte mitosis in the ischemic, border, and remote zones of sham-operated and infarcted hearts at days 7, 14, and 21 after surgery. (H) Quantification of cardiomyocyte sarcomere disassembly in the ischemic, border, and remote zones of sham-operated and infarcted hearts at days 7, 14, and 21 after surgery. Quantitative analyses represent counting of multiple fields from three independent samples per group at each time point (∼9 fields per region per time point). Values presented as mean ± SEM; *P < 0.05. (I) High resolution confocal microscopy images showing cardiomyocytes staining positive for pH3 (green) and troponin T (red) at day 7 after MI. Images are shown at low (Upper) and high (Lower) magnification. Note the complete disorganization of sarcomeric structure in pH3+ cardiomyocytes and the marginalization of sarcomeres to the periphery of mitotic cardiomyocytes. (J) EM of sections of sham-operated (Upper) and infarcted hearts (Lower) at day 7 after surgery. Cardiomyocytes in sham-operated control samples show a tightly organized sarcomeric structure and Z-lines are clearly visible at higher magnification (arrows). In contrast, regenerating cardiomyocytes in MI hearts have a disorganized sarcomeric structure (arrows), along with the appearance of intercellular spaces (asterisk) and also contained sarcomeres aligned along the periphery of the cardiomyocyte (arrowheads). (Scale bars: A, 50 μm; A Inset, E, and I, 20 μm; J, 2 μm.)
Fig. 3.
Fig. 3.
Determining the lineage origin of newly formed cardiomyocytes. (A) Schematic of BrdU administration protocol. (B) Immunostaining showing colocalization of BrdU and Nkx2.5 at day 21 after MI. (Scale bar: 20 μm.) (C) Quantification of the number of BrdU+/Nkx2.5+ nuclei at day 21 after MI. Quantitative analysis represents counting of multiple fields from three independent samples per group (∼9 fields per region). (D) Schematic of cardiomyocyte lineage tracing study design. (E Upper) β-galactosidase enzymatic staining of MYH6-MerCreMer; Rosa26-lacZ reporter mouse heart showing similar staining in sham and MI hearts at day 21 after surgery. Basal and apical sections (below ligature) are shown for each heart. (E Lower) Quantification of the percentage of lacZ+ myocardium in sham and MI hearts showing no difference across regions of the heart. Quantitative analysis represents counting of multiple fields from three independent samples per group (∼9 fields per region). Values presented as mean ± SEM; *P < 0.05.
Fig. 4.
Fig. 4.
Lack of regeneration of 7- and 14-d-old hearts after MI. (A) Masson’s trichrome staining of hearts infarcted at P7 showing fibrosis and lack of regeneration at 7, 14, and 21 d after MI. (B) Masson’s trichrome staining of hearts infarcted at P14 showing a lack of regeneration and significant pathological remodeling at 7, 14, and 21 d after MI. (C and D) Immunostaining and quantification of pH3+ cardiomyocytes and cardiomyocytes with disassembled sarcomeres at day 7 after MI showing lack of myocyte proliferation after MI at P7. Quantitative analyses represent counting of multiple fields from three independent samples per group (∼9 fields per region). Values presented as mean ± SEM. (E) Ventricle weight to body weight ratios for sham and MI groups at 21 d after surgery at either P1 or P14. Values presented as mean ± SEM; n = 5 per group; *P < 0.05. (F) Cell size quantification showing no change in cell size at day 21 after MI at P1 and significant myocyte hypertrophy in the ischemic, border, and remote zones at day 21 after MI at P14. (G) Wheat germ agglutinin staining for sham and MI groups at 21 d after surgery at either P1 or P14. Quantitative analyses represent counting of multiple fields from three independent samples per group (∼90 cells assessed per heart). Values presented as mean ± SEM; *P < 0.05. (Scale bars: A and B, 1 mm; C, 20 μm; G, 50 μm.)
Fig. 5.
Fig. 5.
miR-195 overexpression inhibits neonatal heart regeneration. (A) Immunostaining of WT and TG hearts showing a markedly decreased number of pH3+ cardiomyocytes at day 7 after MI in TG hearts. Arrowheads denote pH3+ cardiomyocytes. Inset is a high magnification image of a cardiomyocyte with disassembled sarcomeres positively stained for pH3. (B) Quantification of pH3+ cardiomyocytes in WT and TG hearts at day 7 after MI. Quantitative analysis represents counting of multiple fields from three independent WT and four TG samples per group (∼9 fields per region). Values presented as mean ± SEM; *P < 0.05. (C) Left ventricular systolic function quantified by FS in WT and TG mice at baseline and at 21 d after MI at P1. Values presented as mean± SEM; n = 5–8 samples per group; *P < 0.05. (D) Masson’s trichrome stained sections showing fibrosis and lack of regeneration of TG hearts at day 21 after MI. (E) Wheat germ agglutinin staining of WT and TG hearts at day 21 after MI at P1. (F) Quantification of cell size showing significant myocyte hypertrophy in the ischemic, border, and remote zones at day 21 after MI in miR-195Tg hearts. Quantitative analyses represent counting of multiple fields from three independent samples per group (∼90 cells assessed per heart). Values presented as mean ± SEM; *P < 0.05. (Scale bars: A and E, 50 μm; D, 2 mm.)
Fig. 6.
Fig. 6.
Postnatal inhibition of the miR-15 family induces cardiomyocyte proliferation and improves cardiac function after MI. (A) Schematic of anti-miR (Anti-15) administration and I/R injury timeline. (B) Representative images of mismatch- and anti-miR–treated hearts after 45 min of ischemia and 24 h of reperfusion. Hearts were perfused with Evans blue dye, and sections were stained with the redox indicator TTC to quantify the extent of myocardial injury. Blue staining represents unaffected, remote myocardium; red staining indicates the area at risk (AAR); white myocardium represents the infarct area of necrosis. (C) Quantification of infarct size in mismatch- and anti-miR–treated mice at 24 h after I/R. The final infarct size is represented as the percentage of AAR/total area of left ventricle (LV), area of infarct (INF)/AAR, and INF/LV. Quantitative analyses represent counting from five mismatch and four anti-miR samples per group (∼4–6 sections per sample). Values presented as mean ± SEM. (D) Serum levels of cardiac troponin I (cTnI) in mismatch- and anti-miR–treated mice at 24 h after I/R. Values presented as mean ± SEM; n = 4 per group. (E) Left ventricular systolic function quantified by fractional shortening (FS) in mismatch and anti-miR–treated mice at baseline and at 7 and 21 d after I/R. Values presented as mean ± SEM; n = 4 (mismatch) and n = 5 (anti-miR); *P < 0.05. (F Left) Image showing proliferating pH3+ cardiomyocytes (arrowheads) and proliferating nonmyocyte (arrow) in anti-miR–treated heart. Inset is a high magnification image of a cardiomyocyte positively stained for pH3. (F Right) Quantification of pH3+ cardiomyocytes in mismatch and anti-miR–treated hearts at day 7 after I/R. Quantitative analysis represents counting of 5–7 sections from five independent samples per group. Values presented as mean ± SEM; *P < 0.05.

Similar articles

Cited by

References

    1. Laflamme MA, Murry CE. Heart regeneration. Nature. 2011;473(7347):326–335. - PMC - PubMed
    1. Bergmann O, et al. 2009. Evidence for cardiomyocyte renewal in humans. Science 324(5923):98–102.
    1. Hsieh PC, et al. Evidence from a genetic fate-mapping study that stem cells refresh adult mammalian cardiomyocytes after injury. Nat Med. 2007;13(8):970–974. - PMC - PubMed
    1. Kajstura J, et al. Cardiomyogenesis in the adult human heart. Circ Res. 2010;107(2):305–315. - PMC - PubMed
    1. Poss KD, Wilson LG, Keating MT. 2002. Heart regeneration in zebrafish. Science 298(5601):2188–2190. - PubMed

Publication types