. 2012 Dec 11:2:155.
doi: 10.3389/fcimb.2012.00155. eCollection 2012.

Toward a molecular pathogenic pathway for Yersinia pestis YopM

Affiliations

Toward a molecular pathogenic pathway for Yersinia pestis YopM

Annette M Uittenbogaard et al. Front Cell Infect Microbiol. .

Abstract

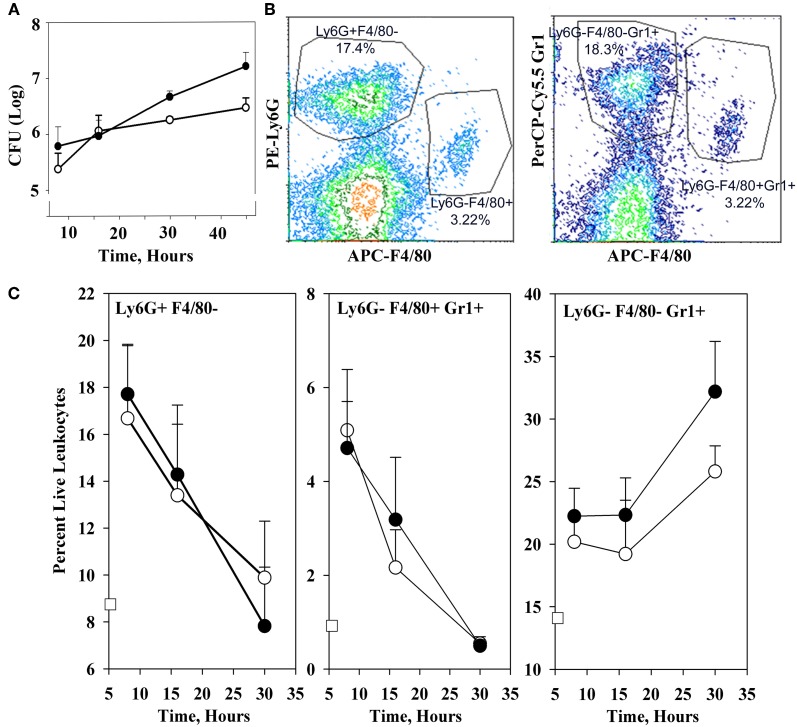
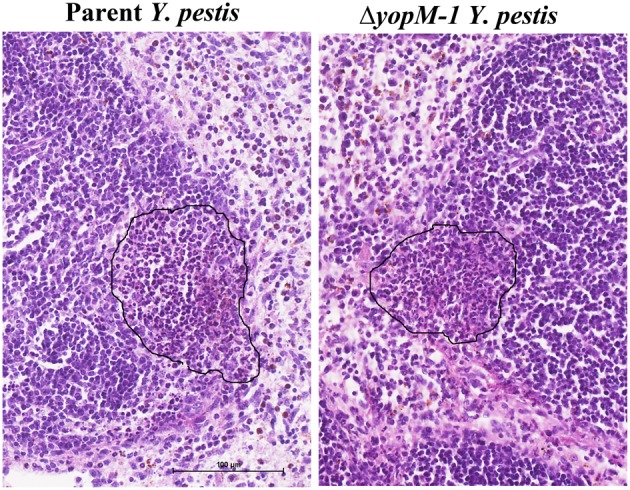
YopM is one of the six "effector Yops" of the human-pathogenic Yersinia, but its mechanism has not been defined. After delivery to J774A.1 monocyte-like cells, YopM can rapidly bind and activate the serine/threonine kinases RSK1 and PRK2. However, in infected mice, effects of Y. pestis YopM have been seen only after 24-48 h post-infection (p.i.). To identify potential direct effects of YopM in-vivo we tested for effects of YopM at 1 h and 16-18 h p.i. in mice infected systemically with 10(6) bacteria. At 16 h p.i., there was a robust host response to both parent and ΔyopM-1 Y. pestis KIM5. Compared to cells from non-infected mice, CD11b(+) cells from spleens of infected mice produced more than 100-fold greater IFNγ. In the corresponding sera there were more than 100-fold greater amounts of IFNγ, G-CSF, and CXCL9, as well as more than 10-fold greater amounts of IL-6, CXCL10, and CXCL1. The only YopM-related differences were slightly lower CXCL10 and IL-6 in sera from mice infected 16 h with parent compared to ΔyopM-1 Y. pestis. Microarray analysis of the CD11b(+) cells did not identify consistent transcriptional differences of ≥4-fold at 18 h p.i. However, at 1 h p.i. mRNA for early growth response transcription factor 1 (Egr1) was decreased when YopM was present. Bone marrow-derived macrophages infected for 1 h also expressed lower Egr1 message when YopM was present. Infected J774A.1 cells showed greater expression of Egr1 at 1 h p.i. when YopM was present, but this pattern reversed at 3 h. At 6 h p.i., Cxcl10 mRNA was lower in parent-strain infected cells. We conclude that decreased Egr1 expression is a very early transcriptional effect of YopM and speculate that a pathway may exist from RSK1 through Egr1. These studies revealed novel early transcriptional effects of YopM but point to a time after 18 h of infection when critical transitional events lead to later major effects on cytokine gene transcription.

Keywords: Yersinia; YopM; chemokine; microarray; plague.


Figures

Figure 1
Figure 1
Infection dynamics and host cellular responses in spleen in the high-dose systemic plague model. C57BL/6 mice were infected intravenously with a dose of 106 of the parent Y. pestis KIM5 (closed circles) or the ΔyopM-1Y. pestis KIM5-3002 (open circles) that had been induced for expression of thermally-upregulated properties for 3 h at 37°C. Bacterial burdens were determined as CFU Panel (A). Bacterial numbers differed significantly for parent and ΔyopM-1 Y. pestis at 30 and 45 h p.i. (P <10−4 and P < 10−2, respectively). Splenic leukocytes were stained with fluorochrome-conjugated antibodies against the surface markers Ly6G, F4/80, and Gr1 as well as the dye EMA which stains cells that have lost membrane integrity, and analyzed by flow cytometry. Panel (B) illustrates the gating strategy used to define and quantify several host cell populations as percent live leukocytes. Panel (C) shows how the percent of EMA (i.e., “live”) leukocytes changed over 30 h of infection for three inflammatory cell types of relevance to the host response to Y. pestis. Values for non-infected mice are given by the open squares on the ordinates. Percentages of Ly6G+ F4/80 PMNs at 16 h were significantly different from those at 8 h for mice infected with the ΔyopM-1 strain (P < 0.05 by student's t-test); those at 30 h differed significantly from 8 h for infections by both Y. pestis strains (P < 10−2 for parent and P < 10−4 for ΔyopM-1). For Ly6G F4/80+ Gr1+ MOs, percentages at both 16 and 30 h differed significantly from those at 8 h for both infections (parent: P < 0.05 for 16 h, P < 10−5 for 30 h; ΔyopM-1: P < 10−2 for 16 h, P < 10−5 for 30 h). For the Ly6G F4/80 Gr1+ population, percentages differed only for 30 compared to 8 h p.i. (P < 10−2 for parent Y. pestis and P < 10−3 for ΔyopM-1). Each datum point gives the averages ± standard deviation (SD) for pooled data from six mice in two independent experiments.
Figure 2
Figure 2
Histopathology of spleen at 16 h p.i. C57BL/6 mice were infected for 16 h as in the experiments of Figure 1, and spleens were fixed in formalin and stained with hematoxylin and eosin. Representative sections are shown. Left panel, spleen from a mouse infected with parent Y. pestis; Right panels, spleen from a mouse infected with ΔyopM-1 Y. pestis. In each panel the surround indicates an inflammatory focus at the edge of a lymphoid follicle.
Figure 3
Figure 3
Flow cytometric analysis of CD11b+ cell populations after 1 h infection. C57BL/6 mice were infected for 1 h with 106 thermally-induced parent or ΔyopM-1 Y. pestis, and CD11b+ cells were obtained from spleens as described in the legend to Figure 2. Samples were analyzed by flow cytometry for the presence of Ly6G, CD11b, Gr1, CD11c, and for staining by EMA. The bars represent the averages ± SD of the percent live leukocytes. Solid bars, mice infected with parent Y. pestis (pooled data from two experiments and 8 mice); open bars, mice infected with ΔyopM-1 Y. pestis (pooled data from three experiments and 12 mice).

References

    1. Akopyan K., Edgren T., Wang-Edgren H., Rosqvist R., Fahlgren A., Wolf-Watz H., et al. (2011). Translocation of surface-localized effectors in type III secretion. Proc. Natl. Acad. Sci. U.S.A. 108, 1639–1644 10.1073/pnas.1013888108 - DOI - PMC - PubMed
    1. Auffray C., Sieweke M. H., Geissmann F. (2009). Blood monocytes; development, heterogeneity, and relationship with dendritic cells. Annu. Rev. Immunol. 27, 669–692 10.1146/annurev.immunol.021908.132557 - DOI - PubMed
    1. Becker R. A., Chambers J. M., Wilks A. R. (1988). The New S Language. New York, NY: Chapman and Hall
    1. Benabdillah R., Mota L. J., Lütelschwab S., Demoinet E., Cornelis G. R. (2004). Identification of a nuclear localization signal in YopM from Yersinia spp. Microb. Pathog. 36, 247–261 10.1016/j.micpath.2003.12.006 - DOI - PubMed
    1. Bergsbaken T., Cookson B. T. (2007). Macrophage activation redirects yersinia-infected host cell death from apoptosis to caspase-1-dependent pyroptosis. PLoS Pathog. 3:e161 10.1371/journal.ppat.0030161 - DOI - PMC - PubMed

Publication types

MeSH terms