. 2013 Dec 10;19(17):2054-67.
doi: 10.1089/ars.2012.4988. Epub 2013 Feb 5.

Vitamin C promotes maturation of T-cells

Affiliations

Vitamin C promotes maturation of T-cells

Jared Manning et al. Antioxid Redox Signal. .

Abstract

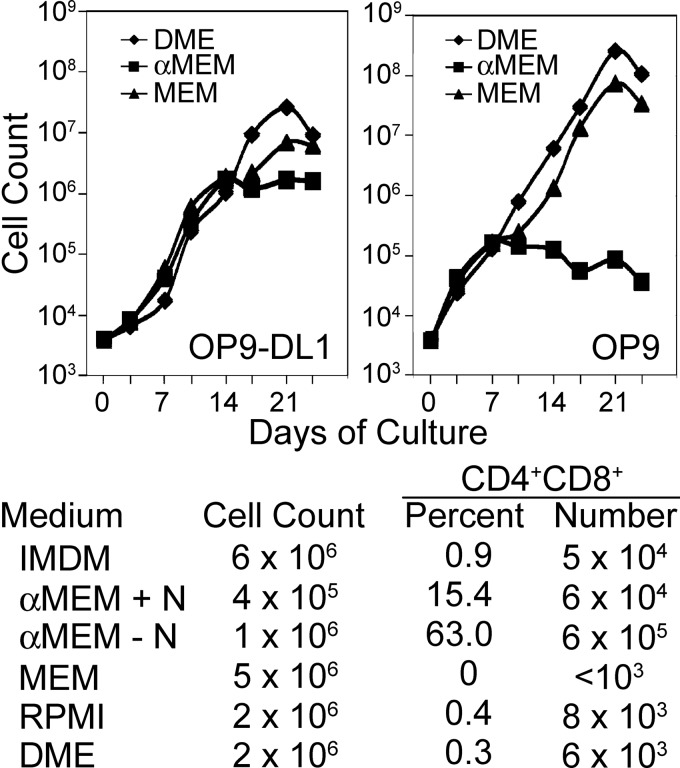
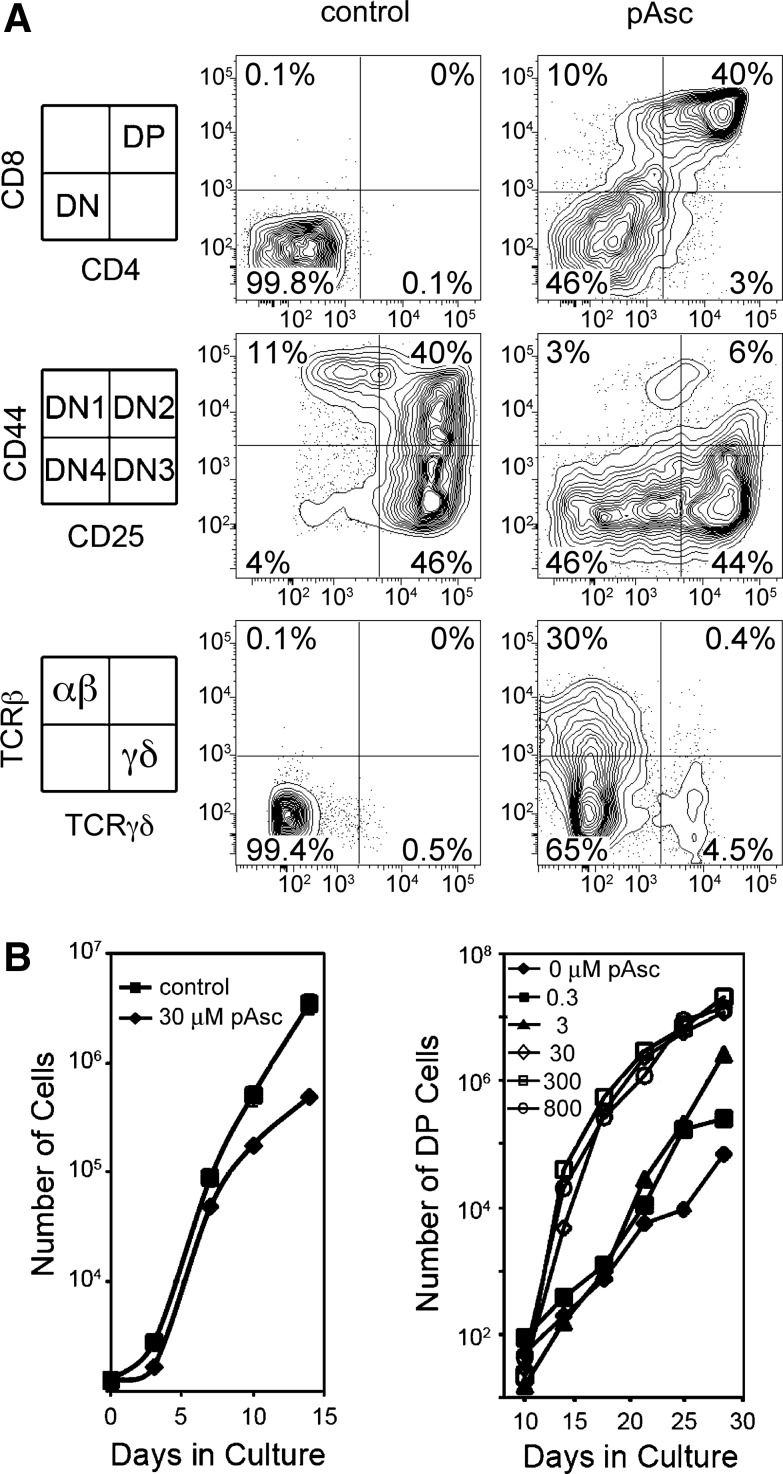
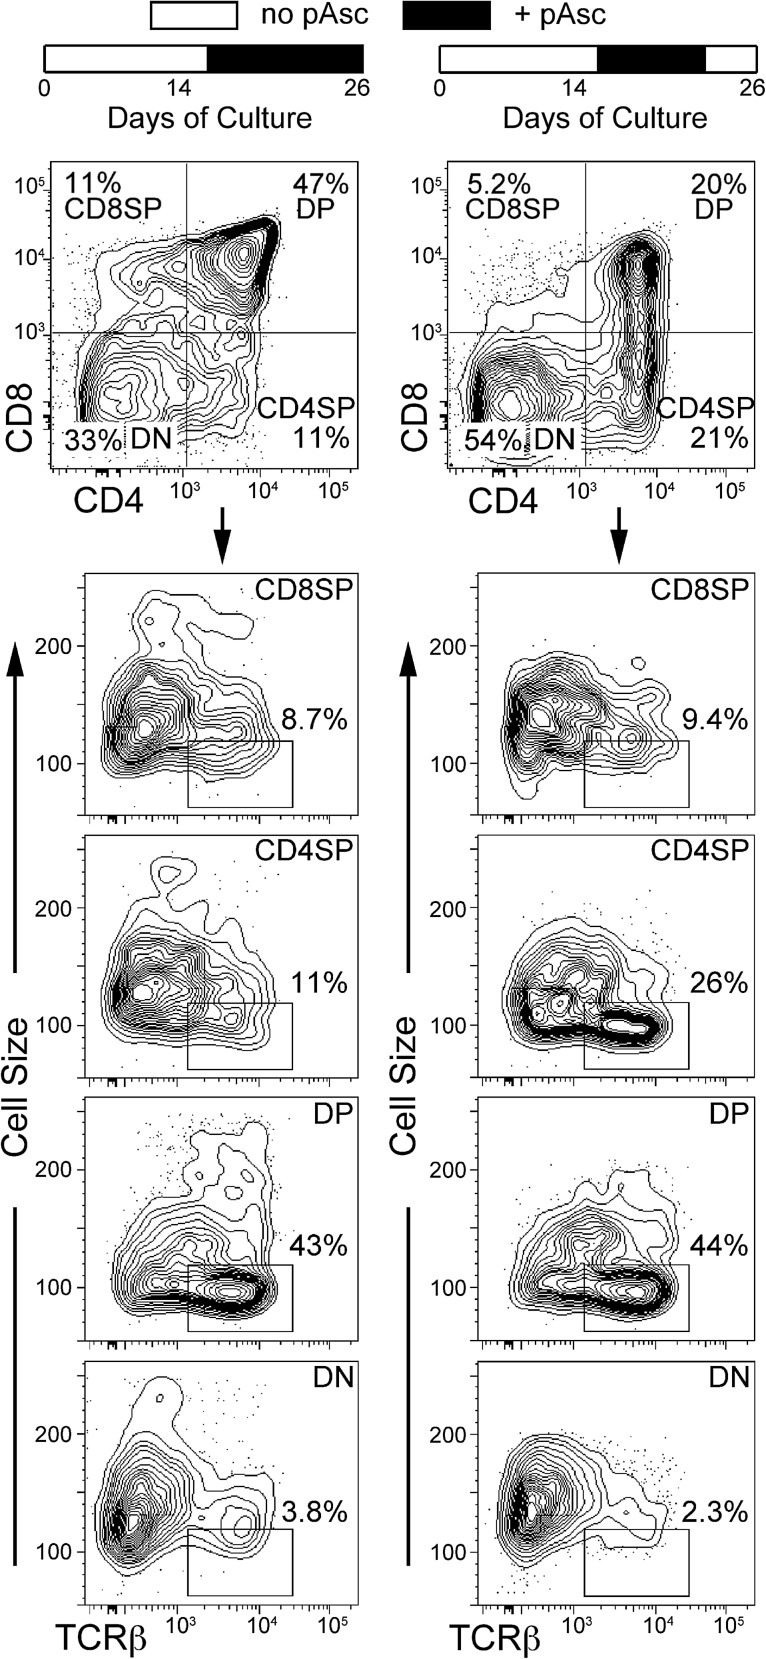
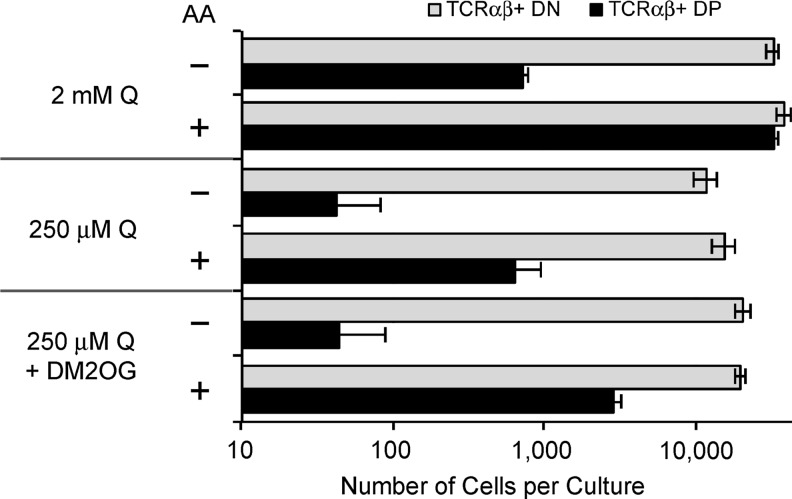
Aims: Vitamin C (ascorbic acid) is thought to enhance immune function, but the mechanisms involved are obscure. We utilized an in vitro model of T-cell maturation to evaluate the role of ascorbic acid in lymphocyte development.

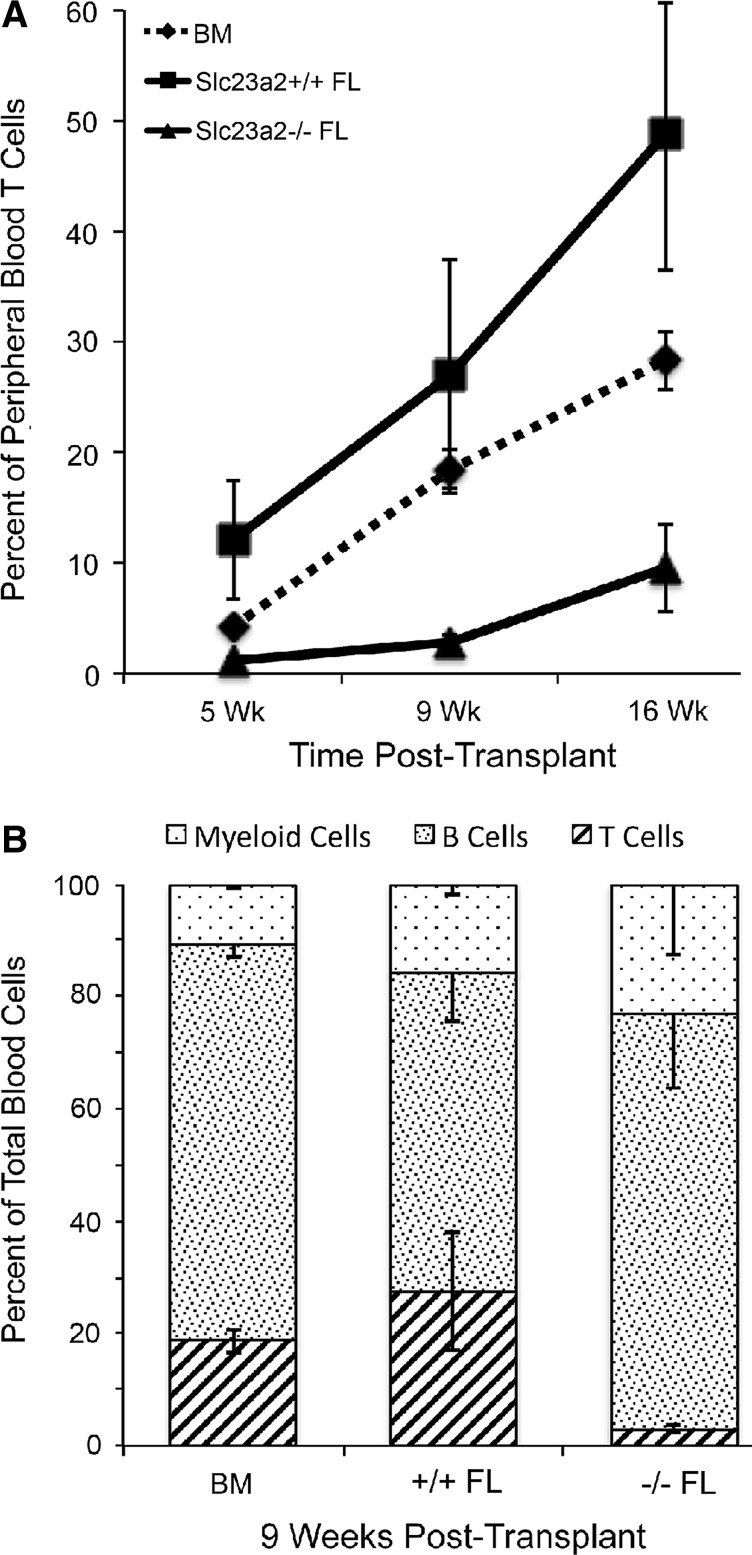
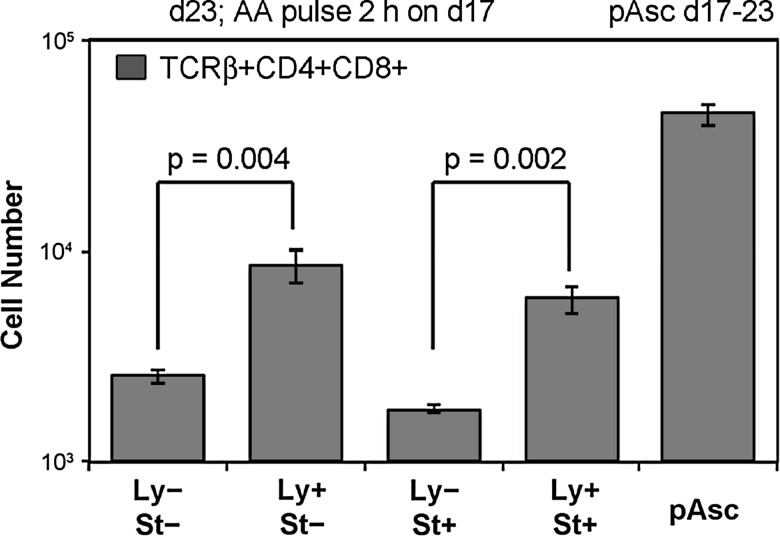
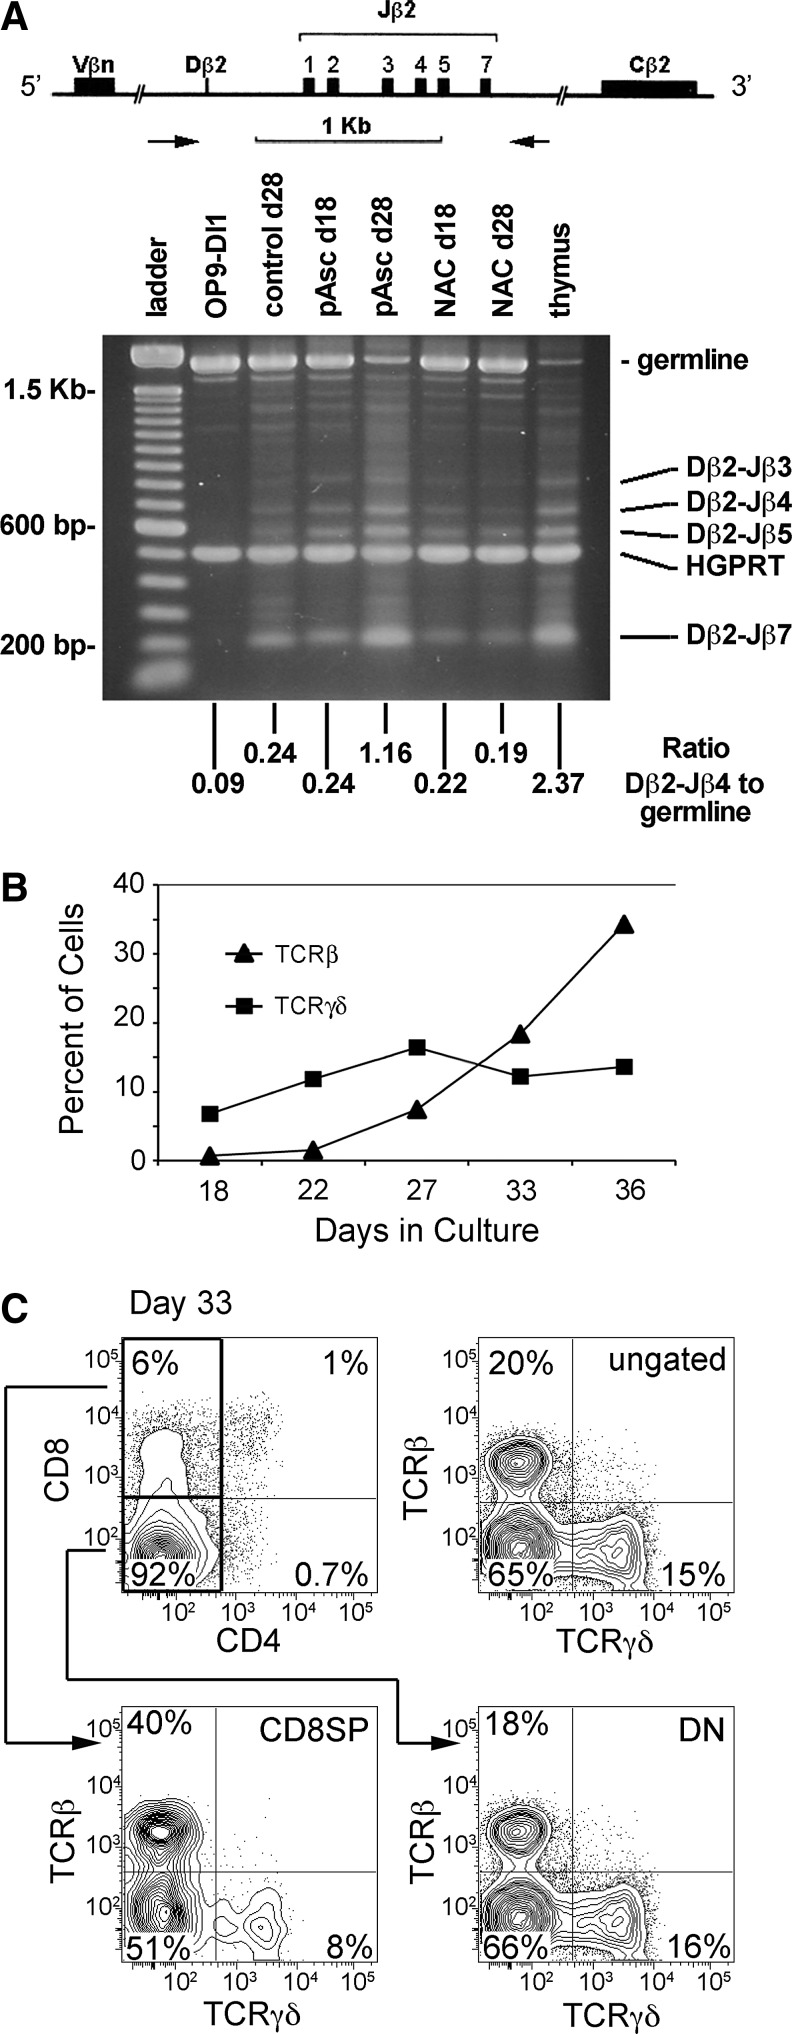
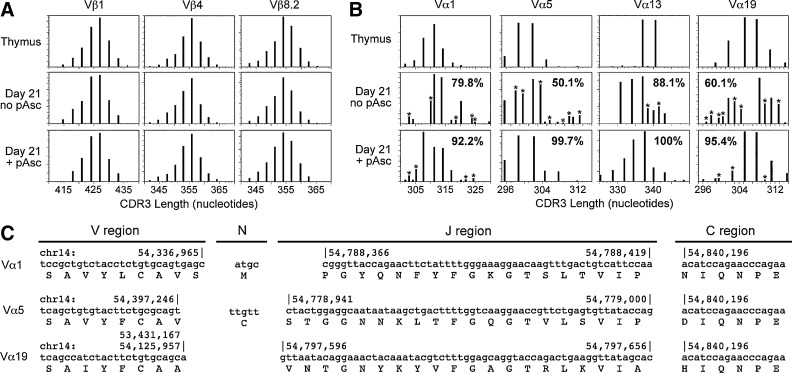
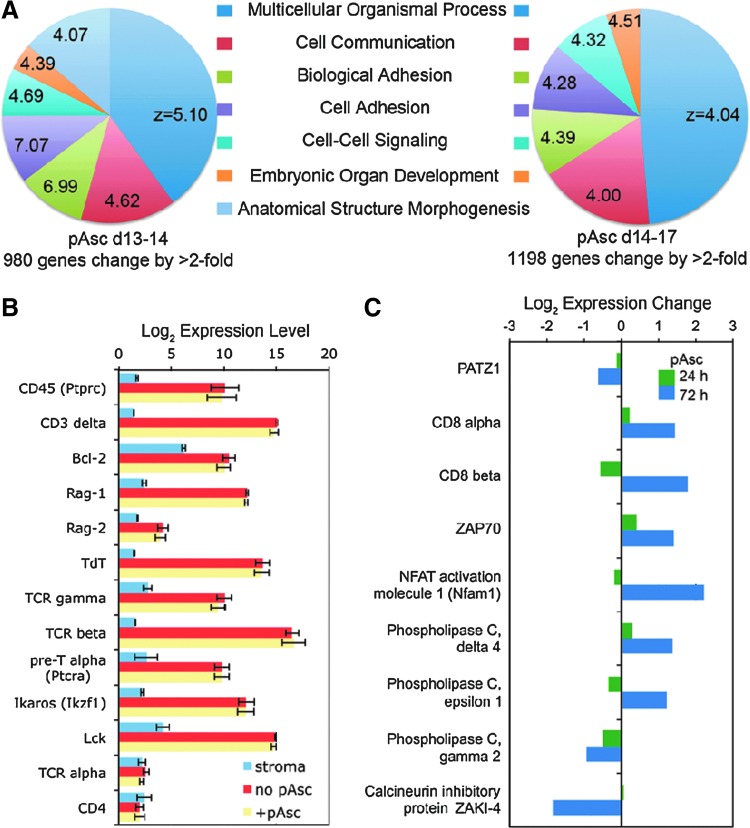
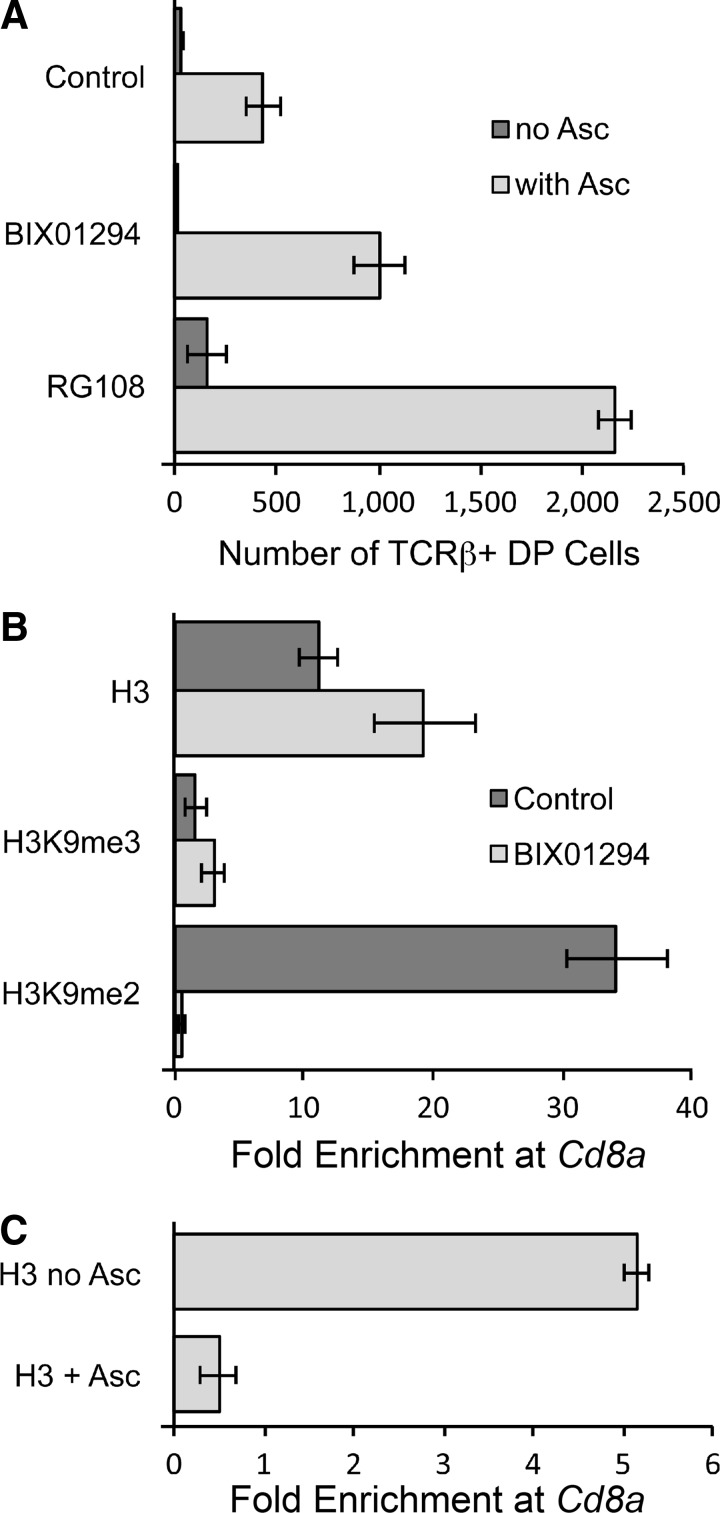
Results: Ascorbic acid was essential for the developmental progression of mouse bone marrow-derived progenitor cells to functional T-lymphocytes in vitro and also played a role in vivo. Ascorbate-mediated enhancement of T-cell development was lymphoid cell-intrinsic and independent of T-cell receptor (TCR) rearrangement. Analysis of TCR rearrangements demonstrated that ascorbic acid enhanced the selection of functional TCRαβ after the stage of β-selection. Genes encoding the coreceptor CD8 as well as the kinase ZAP70 were upregulated by ascorbic acid. Pharmacologic inhibition of methylation marks on DNA and histones enhanced ascorbate-mediated differentiation, suggesting an epigenetic mechanism of Cd8 gene regulation via active demethylation by ascorbate-dependent Fe(2+) and 2-oxoglutarate-dependent dioxygenases.

Innovation: We speculate that one aspect of gene regulation mediated by ascorbate occurs at the level of chromatin demethylation, mediated by Jumonji C (JmjC) domain enzymes that are known to be reliant upon ascorbate as a cofactor. JmjC domain enzymes are also known to regulate transcription factor activity. These two mechanisms are likely to play key roles in the modulation of immune development and function by ascorbic acid.

Conclusion: Our results provide strong experimental evidence supporting a role for ascorbic acid in T-cell maturation as well as insight into the mechanism of ascorbate-mediated enhancement of immune function.


Figures

<b>FIG. 1.</b>
FIG. 1.
Basal cell culture medium formulations profoundly influence T-cell maturation in vitro. Top Panels: Cellular expansion of lymphocyte progenitor cells cultured in T-cell (OP9-DL1) or B-cell (OP9) conditions in the indicated basal culture medium. All cultures were supplemented with 1 ng/ml interleukin (IL)-7 and 5 ng/ml fms-like tyrosine kinase-3 ligand (Flt3L). Lower panel: Effects of basal medium formulations on T-lymphocyte progenitor expansion and differentiation in OP9-DL1 cocultures as shown in the top left panel. The alpha modification of minimal essential medium (αMEM)+N medium is a formulation containing nucleosides, while the αMEM−N formulation lacks nucleosides. All cultures were initiated by seeding 2×10³ fluorescence-activated cell-sorting (FACS)-sorted LSK-Thy-1.1-neg cells onto a feeder layer of stromal cells and contained 1 ng/ml IL-7 and 5 ng/ml Flt3L with otherwise identical additives as outlined in the Materials and Methods section. Cell numbers were determined by hemocytometer counting at each passage. Cultures were passaged every 3–4 days, and appropriate dilutions were made to maintain a cell density of <5×10⁵ cells/ml. The cell counts were corrected by a factor corresponding to the product of these dilutions. The percentage of CD4+CD8+ DP cells was determined by FACS analysis after 14 days of culture and was converted to absolute numbers based on the cell counts.
<b>FIG. 2.</b>
FIG. 2.
Modulation of T-cell maturation by I-ascorbic acid 2-phosphate (pAsc). (A) Cultures maintained for 17 days with 5 ng/ml each of Flt3L and IL-7 in the presence or absence of pAsc (800 μM) as indicated were evaluated for the expression of cell surface antigens by flow cytometry. (B) Cultures established as above in the presence of the indicated concentrations of pAsc were evaluated for total cellular expansion and for the number of double-positive (DP) cells.
<b>FIG. 3.</b>
FIG. 3.
Addition of pAsc at later stages of OP9-DL1 cultures induces T-cell maturation, and the DP population requires continual exposure to pAsc for maintenance. LSK-Thy-1.1-neg cells cultured in an MEM with 1 ng/ml IL-7 and 5 ng/ml Flt3L were maintained for 14 days in the absence of ascorbate, with passages every 3–4 days as described in the Materials and Methods section. Cultures were supplemented with 30 μM pAsc beginning at 14 days. On the final passage at day 23, replicate cultures were established in which pAsc was either included or not for the final 3 days of culture. All cultures were analyzed after 26 days.
<b>FIG. 4.</b>
FIG. 4.
Fetal liver cells lacking the ability to accumulate ascorbic acid due to targeted mutation of Slc23a2 have defective T-cell maturation when transplanted into irradiated recipients. Fetal liver cells (Ly-5.2) identified as Slc23a2+/+ or Slc23a2−/− by polymerase chain reaction (PCR) were mixed with equal numbers of normal bone marrow cells (Ly-5.1/Ly-5.2) for injection at a dose of 2×10⁶ total cells into four lethally irradiated recipient mice (Ly-5.1). Fetal liver-derived peripheral blood cells were identified by flow cytometry based on Ly-5.1 and Ly-5.2 antibody staining and phenotyped as myeloid, T-cell, or B-cell lineages at the indicated times after transplantation. Panel (A) shows T-lineage engraftment at three time points post-transplantation. Panel (B) shows myeloid, T, and B lineages 9 weeks post-transplantation. BM indicates the lineage contributions by the Ly-5.1/Ly-5.2 bone marrow cells in the same recipient mice, pooling data from both Slc23a2+/+ and Slc23a2−/− FL recipients. At 16 weeks post-transplantation, the frequency of Slc23a2−/− T cells was 20% of that seen with Slc23a2+/+ T cells (p=0.023 by two-tailed t-test). Values are mean±standard error.
<b>FIG. 5.</b>
FIG. 5.
The effect of ascorbic acid on T-cell maturation is cell intrinsic. OP9-DL1 stromal cells were cultured with 2×10³ FACS-sorted LSK-Thy-1.1-neg cells in the presence of 5 ng/ml each of IL-7 and Flt3L for 17 days, with passages every 3–4 days. On the 17th day of culture, nonadherent lymphoid cells were harvested by gentle rinsing of the OP9-DL1 monolayer and transferred to a new culture plate for 30 min to deplete residual OP9-DL1 cells by adherence. The lymphoid cells were then incubated at 37°C for 2 h with cytokines as above in the absence (Ly−) or presence (Ly+) of ascorbic acid (250 μM). In parallel, established monolayers of OP9-DL1 cells were also incubated in the absence (St−) or presence (St+) of the same concentration of ascorbic acid. After 2 h, all cell populations were washed, and cultures were established in which lymphocytes, stromal cells, both cell populations, or neither population was exposed to ascorbic acid. As a positive control, pAsc was added at a concentration of 250 μM to one set of cultures. After 6 days, quadruplicate cultures were harvested for cell counting and phenotypic analysis as indicated. Values represent mean±standard error. A two-tailed t-test was used for statistical analysis.
<b>FIG. 6.</b>
FIG. 6.
Analysis of the effects of ascorbic acid and pAsc on T-cell receptor-β (TCRβ) rearrangement. (A) Analysis of TCRβ rearrangements by PCR. The primer set amplifies a germline fragment of 1.8 kb in non-T cells. During Dβ-to-Jβ recombination, the germline fragment is lost and is replaced by smaller fragments, depending on the particular Jβ segment that is joined to Dβ. Subsequently, Vβ-to-DβJβ rearrangement results in the loss of both germline and Dβ-to-Jβ-specific bands. Band ratios were determined using ImageJ software. (B) Cultures established as described in Figure 5 legend were maintained without ascorbate for up to 36 days to evaluate cell surface expression of TCRαβ and TCRγδ over time by FACS analysis. (C) A representative FACS analysis of the day-33 data shown in Panel (B), showing a relative lack of maturation based on CD4/CD8 staining. The distribution of TCRβ+ and TCRγδ+ cells in the total population (ungated) as well as in the gated CD8-single-positive (CD8SP) and double-negative (DN) populations is shown.
<b>FIG. 7.</b>
FIG. 7.
TCR diversity generated in OP9-DL1 cultures. (A) RNA isolated from T-cells maturing in OP9-DL1 cultures or freshly isolated thymus tissue was reverse-transcribed and evaluated by immunoscope analysis of the TCRβ transcripts as described in the Materials and Methods section. (B) As in Panel (A), except TCRα, transcripts were evaluated by immunoscope analysis. CDR3 regions with nucleotide lengths corresponding to those seen in control thymus samples were identified, and the area under each peak relative to the total peak area was calculated. The sums of these numbers shown in the lower panels indicate the percentage of CDR3 amplicons that correspond in length to those seen in thymus samples. Amplicons marked (*) do not correspond to the size of products seen in the control thymus samples. (C) Individual amplicons cloned from the reactions shown in Panel (B) were sequenced to confirm proper rearrangement of the TCRα loci. Shown are three representative sequences of ∼100 sequenced products. The numbers above the nucleotide sequences indicate the genomic location of each region. In the case of Vα19, two genomic V regions corresponding to the sequenced amplicon were identified. The genomic locations of both regions are indicated, since it is not possible to identify from which of these regions the V gene is derived.
<b>FIG. 8.</b>
FIG. 8.
Microarray analysis of gene expression changes in response to pAsc. Cultures established as described in the Materials and Methods section were maintained for 14 days before addition of 800 μM pAsc. Cultures with and without pAsc were harvested after 24 or 72 h for RNA isolation and microarray analysis as described in the Materials and Methods section. (A) Gene ontogeny analysis of expression changes after 24 or 72 h in pAsc. The Z values indicate significance as described by Doniger et al. (10); values >2 indicate enrichment of genes associated with a functional group of genes compared to the total set of genes. (B) Candidate genes expressed during the DN stages of T cell development that are not changed in response to pAsc. (C) Candidate genes involved in signal transduction that are altered in expression after addition of pAsc to cultures.
<b>FIG. 9.</b>
FIG. 9.
Extracellular glutamine (Q) is required for the DN-to-DP transition promoted by ascorbic acid. OP9-DL1 cocultures were established and maintained without ascorbic acid for 19 days, at which time cultures were passaged into the conditions as indicated. The cell-permeable dimethyl-2-OG (DM2OG) was added at 1 mM, while ascorbic acid (AA) was added at 100 μM. Cultures were harvested 8 days later, and the total number of lymphoid cells per culture was determined using an Accuri C6 instrument. Cells were then labeled with antibodies for analysis by flow cytometry using a B-D Canto instrument. The absolute number of TCRαβ+ DN and DP cells in triplicate cultures was calculated and is shown as mean value±standard error.
<b>FIG. 10.</b>
FIG. 10.
Methyltransferase enzyme inhibition potentiates the ability of ascorbic acid to promote the DN-to-DP transition in OP9-DL1 cultures. (A) OP9-DL1 cocultures were maintained without ascorbic acid for 19 days, at which time RG108 (5 μM) or BIX01294 (50 nM) was added with or without 100 μM ascorbic acid. Cultures were evaluated 8 days later as described in the legend for Figure 9. Values from replicate 1 ml cultures are shown with mean±standard error. (B) Cultures maintained without ascorbic acid for 19 days were replated in the presence or absence of 30 nM BIX01294 and cultured for an additional 8 days. Lymphocytes obtained from these cultures were processed for chromatin immunoprecipitation (ChIP) using antibodies as indicated. The fold enrichment of the Cd8a promoter region relative to β-actin DNA is shown as the mean±standard error of triplicate technical replicates. (C) Cultures maintained without ascorbic acid for 21 days were replated with or without ascorbic acid and harvested for ChIP 72 h later. ChIP for total histone H3 protein was performed and analyzed as in Panel (B). Data indicate mean±standard deviation of 2 (no ascorbic acid) or 3 (+ascorbic acid) biological replicates with three technical replicates each.

References

    1. Arkan MC, Leonarduzzi G, Biasi F, Basaga H, and Poli G. Physiological amounts of ascorbate potentiate phorbol ester-induced nuclear-binding of AP-1 transcription factor in cells of macrophagic lineage. Free Radic Biol Med 31: 374–382, 2001 - PubMed
    1. Babaev VR, Whitesell RR, Li L, Linton MF, Fazio S, and May JM. Selective macrophage ascorbate deficiency suppresses early atherosclerosis. Free Radic Biol Med 50: 27–36, 2011 - PMC - PubMed
    1. Bergeron S, Anderson DK, and Swanson PC. RAG and HMGB1 proteins: purification and biochemical analysis of recombination signal complexes. Methods Enzymol 408: 511–528, 2006 - PubMed
    1. Buer J, Aifantis I, DiSanto JP, Fehling HJ, and von Boehmer H. Role of different T cell receptors in the development of pre-T cells. J Exp Med 185: 1541–1547, 1997 - PMC - PubMed
    1. Carr EL, Kelman A, Wu GS, Gopaul R, Senkevitch E, Aghvanyan A, Turay AM, and Frauwirth KA. Glutamine uptake and metabolism are coordinately regulated by ERK/MAPK during T lymphocyte activation. J Immunol 185: 1037–1044, 2010 - PMC - PubMed

Publication types

MeSH terms