. 2012 Dec 18:12:147.
doi: 10.1186/1472-6947-12-147.

The R0 package: a toolbox to estimate reproduction numbers for epidemic outbreaks

Affiliations

The R0 package: a toolbox to estimate reproduction numbers for epidemic outbreaks

Thomas Obadia et al. BMC Med Inform Decis Mak. .

Abstract

Background: Several generic methods have been proposed to estimate transmission parameters during an outbreak, especially the reproduction number. However, as of today, no dedicated software exists that implements these methods and allow comparisons.

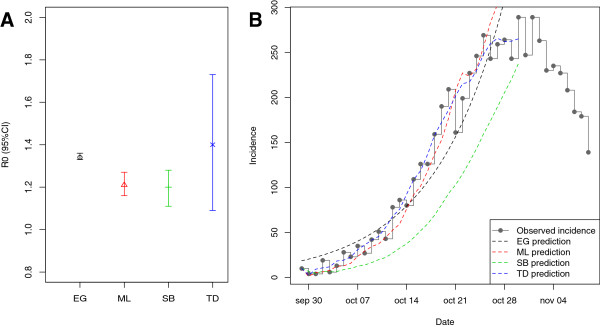
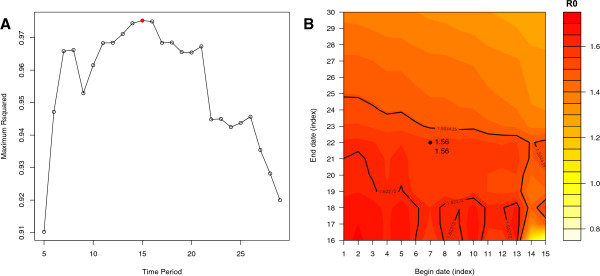
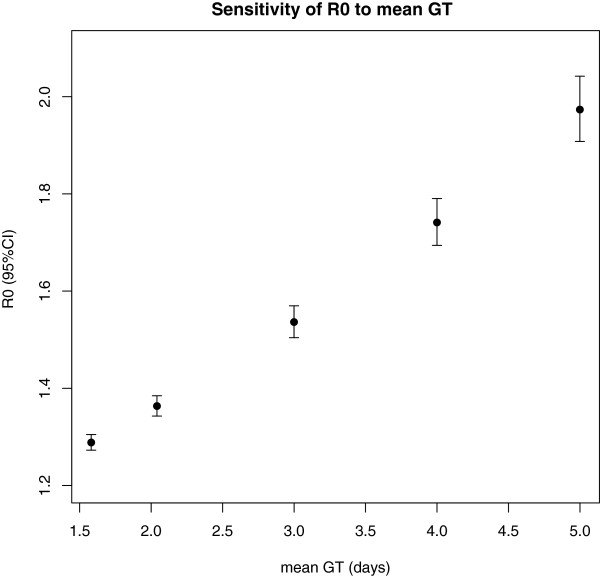
Results: A review of generic methods used to estimate transmissibility parameters during outbreaks was carried out. Most methods used the epidemic curve and the generation time distribution. Two categories of methods were available: those estimating the initial reproduction number, and those estimating a time dependent reproduction number. We implemented five methods as an R library, developed sensitivity analysis tools for each method and provided numerical illustrations of their use. A comparison of the performance of the different methods on simulated datasets is reported.

Conclusions: This software package allows a standardized and extensible approach to the estimation of the reproduction number and generation interval distribution from epidemic curves.


Figures

Figure 1
Figure 1
Estimates of the reproduction ratio and goodness of fit. A) Estimates of the reproduction ratio by four different methods (see text for details). B) Observed incidence (step function) and model predicted incidence for each method.
Figure 2
Figure 2
Sensitivity of the reproduction ratio to the choice of the time period for estimation. A) Maximum deviance R-squared statistic for time periods of increasing duration. The red dot corresponds with the best value. B) Estimates of the reproduction ratio according to various begin and end dates for the time period. The value corresponding to the best fit is shown as a dot, and the solid black lines show the limits of the corresponding 95%CI. In other words, an estimate that falls within the 95%CI of the value showing the best fit can be achieved by using a wide range of begin and end dates. These dates are the ones producing values between the solid black lines.
Figure 3
Figure 3
Sensitivity of the reproduction number to the choice of the generation time distribution. Reproduction ratio estimates were computed using different mean generation times. Confidence intervals are shown as vertical bars.

Similar articles

Cited by

References

    1. Khan K, Arino J, Hu W, Raposo P, Sears J, Calderon F, Heidebrecht C, Macdonald M, Liauw J, Chan A, Gardam M. Spread of a Novel Influenza A (H1N1) Virus via Global Airline Transportation. N Engl J Med. 2009;361:212–214. doi: 10.1056/NEJMc0904559. - DOI - PubMed
    1. World Health Organization. Global Surveillance during an Influenza Pandemic. 2009. http://www.who.int/csr/disease/swineflu/global_pandemic_influenza_survei....
    1. Boëlle P-Y, Ansart S, Cori A, Valleron A-J. Transmission parameters of the A/H1N1 (2009) influenza virus pandemic: a review. Influenza and Other Respiratory Viruses. 2011;5:306–316. doi: 10.1111/j.1750-2659.2011.00234.x. - DOI - PMC - PubMed
    1. Wallinga J, Lipsitch M. How generation intervals shape the relationship between growth rates and reproductive numbers. Proceedings of the Royal Society B: Biological Sciences. 2007;274:599. doi: 10.1098/rspb.2006.3754. - DOI - PMC - PubMed
    1. Chowell G, Viboud C, Simonsen L, Miller MA, Acuna-Soto R, Díaz J, Martínez-Martín AF. The 1918–19 Influenza Pandemic in Boyacá. Colombia. Emerging infectious diseases. 2012;18:48. - PMC - PubMed

Publication types

LinkOut - more resources