. 2012 Dec 19:9:55.
doi: 10.1186/1742-4682-9-55.

The biochemistry of acetaminophen hepatotoxicity and rescue: a mathematical model

Affiliations

The biochemistry of acetaminophen hepatotoxicity and rescue: a mathematical model

Rotem Ben-Shachar et al. Theor Biol Med Model. .

Abstract

Background: Acetaminophen (N-acetyl-para-aminophenol) is the most widely used over-the-counter or prescription painkiller in the world. Acetaminophen is metabolized in the liver where a toxic byproduct is produced that can be removed by conjugation with glutathione. Acetaminophen overdoses, either accidental or intentional, are the leading cause of acute liver failure in the United States, accounting for 56,000 emergency room visits per year. The standard treatment for overdose is N-acetyl-cysteine (NAC), which is given to stimulate the production of glutathione.

Methods: We have created a mathematical model for acetaminophen transport and metabolism including the following compartments: gut, plasma, liver, tissue, urine. In the liver compartment the metabolism of acetaminophen includes sulfation, glucoronidation, conjugation with glutathione, production of the toxic metabolite, and liver damage, taking biochemical parameters from the literature whenever possible. This model is then connected to a previously constructed model of glutathione metabolism.

Results: We show that our model accurately reproduces published clinical and experimental data on the dose-dependent time course of acetaminophen in the plasma, the accumulation of acetaminophen and its metabolites in the urine, and the depletion of glutathione caused by conjugation with the toxic product. We use the model to study the extent of liver damage caused by overdoses or by chronic use of therapeutic doses, and the effects of polymorphisms in glucoronidation enzymes. We use the model to study the depletion of glutathione and the effect of the size and timing of N-acetyl-cysteine doses given as an antidote. Our model accurately predicts patient death or recovery depending on size of APAP overdose and time of treatment.

Conclusions: The mathematical model provides a new tool for studying the effects of various doses of acetaminophen on the liver metabolism of acetaminophen and glutathione. It can be used to study how the metabolism of acetaminophen depends on the expression level of liver enzymes. Finally, it can be used to predict patient metabolic and physiological responses to APAP doses and different NAC dosing strategies.


Figures

Figure 1
Figure 1
Acetaminophen metabolism. Blue boxes indicate substrates: APAP, acetaminophen; APAP-S, APAP-sulfonate; APAP-G, APAP-glucoronidate; NAPQI, N-acetyl-p-benzoquinone imine; NAPQI-COV, covalent binding of NAPQI; NAPQI-GSH, NAPQI conjugated with glutathione; PAPS, 3’-Phosphoadenosine-5’-phosphosulfate; GSH, glutathione. The light orange ovals indicate the enzymes that catalyze reactions: SULT, sulfotransferase; UGT, glucuronosyltransferase; CYP, cytochrome P-450 oxidase; GST, glutathione S-transferase.
Figure 2
Figure 2
Times courses in the plasma. Panel A shows model calculations of the time courses of APAP, APAP-S, and APAP-G in the plasma after an APAP dose of 20mg/kg. Panel B shows the values measured in the plasma redrawn from Prescott et al. [4].
Figure 3
Figure 3
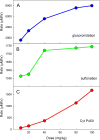
Liver reaction velocities as function of dose. Panel A shows the sum of the rates of the glucoronidation reactions in the liver 0.5 hours after the dose for a range of doses. The normal dose is 20 mg/kg assuming a 60 kg individual. Similarly, Panels B and C show the rates of the sulfation reaction and the sum of the P450 reactions, respectively. The sulfation reaction saturates at relatively modest doses.
Figure 4
Figure 4
Liver reaction velocities as percent of velocities for a therapeutic dose. The velocities of the glucoronidation, sulfation, and P450 reactions are shown as a percentage of the velocities for a normal dose of 20 mg/kg at 0.5 hours after the dose. Note the steep rise of the P450 reactions as the dose increases.
Figure 5
Figure 5
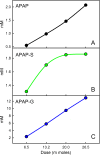
Accumulation of metabolites in the urine. Panels A, B, and C show the accumulation of APAP, APAP-S, and APAP-G, respectively, in the urine over a 24 hour period as a function of APAP dose. The results correspond well to those reported in [7]. We give the dose in moles for easy comparison to the experimental data.
Figure 6
Figure 6
Glutathione depletion and covalent binding. Panel A shows model results. The blue curve shows the liver GSH concentration as a percentage of normal (left scale) 2 hours after the a dose of APAP as a function of dose size. The red curve shows the concentration of covalent binding of NAPQI (right scale) scaled to equal 2 at extremely high doses for easy comparison with the results of Mitchell et al. [6]. Panel B shows the comparable experimental results redrawn from [6] for the same two quantities.
Figure 7
Figure 7
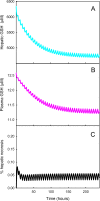
Glutathione depletion and hepatic necrosis under chronic therapeutic dosing. Panels A, B, and C show the model computations liver GSH, plasma GSH, and liver necrosis as a result of therapeutic dosing of APAP(1 gram every 6 hours) for 10 days. The curves reach their new steady states after about 150 hours. The curves oscillate because of the period dosing of APAP, the resynthesis of GSH in the liver, and regeneration of cells in the liver.
Figure 8
Figure 8
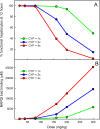
The effects of APAP dose and CYP activity on covalent binding and necrosis. Panel A: Model computations show the effect of P450 activity on liver necrosis at 12 hours after APAP doses of various sizes (normal, green; twice normal, blue; four times normal, red). Liver failure is thought to occur when the percent of functional hepatocytes falls below 30% [10]. Panel B: Model computations of the effect of of P450 activity on the covalent binding of NAPQI at 12 hours after APAP doses of various sizes (normal, green; twice normal, blue; four times normal, red). For relatively modest doses, P450 activity has little effect in both cases. However, the effect of P450 activity is dramatic for high doses.
Figure 9
Figure 9
Polymorphisms in glucoronosyl transferases affect liver damage. Many polymorphisms in glucoronosyl tranferase enzymes reduce their activity by 50% or more (see text). The black, blue, and red curves show model calculations of the time courses of the percentage of functional hepatocytes in response to a 10 g overdose if the Vmax for the four glucoronosyl tranferases are normal (as given in Methods), 50% of normal, or 10% of normal, respectively. The activity of the glucoronosyl tranferases has a dramatic effect on liver damage. With normal parameter values (black curve) there is almost no hepatocyte death. However, at the 10% level (red curve), the number of functional hepatocytes decreases well below the 30% level thought to be the threshold for liver failure [10].
Figure 10
Figure 10
Liver GSH depletion and recovery. The black, blue, magenta, green, and red curves show liver GSH depletion and recovery after a therapeutic dose (1 g) of APAP, and after 5 g, 10 g, 15g, and 20 g doses, respectively. Liver GSH is almost completely depleted between 2 hours and 10 hours after the 15 gram dose and after 48 hours liver GSH has recovered only to about 1/2 of normal. Even for the therapeutic dose, liver GSH has not completely recovered after 48 hours.
Figure 11
Figure 11
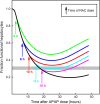
Time course of the percent functional hepatocytes after a 22 g overdose and different NAC rescue times. The black curve shows model computations of the percentage of function hepatocytes after an 22 g dose of APAP. The curve decreases well below the gray bar at the 30% level below which liver failure usually occurs. The green curve shows the time course of functional hepatocytes with rescue by 36 mM NAC given continuously for one hour starting at 2 hours after the overdose. The green curve stays well above the 30% threshold. The blue, red, cyan, and magenta curves show the time courses of functional hepatocytes if the rescue dose is given at 6, 10, 14, 18 hours respectively. The curves show clearly the importance of early rescue.
Figure 12
Figure 12
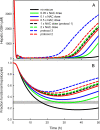
The effects of different NAC doses and rescue protocols on liver GSH and functional hepatocytes. Panel A shows time courses liver GSH concentrations and Panel B shows time courses of functional hepatocytes. For all simulations the APAP dose was 22g, which is lethal without NAC rescue. The black curves show the time course of liver GSH and functional hepatocytes with no NAC rescue. The dashed black curves show the effects of rescue with a dose of 36mM NAC given over a one hour period starting two hours after the APAP dose (protocol 1). If we rescue over one hour with twice as much NAC (green dashed curves) or half as much NAC (solid red curves) the results are very similar. However, rescue with 1/10 (solid blue curves) and 1/20 (solid green curves) the normal NAC dose over a one hour period starting at 2 hours show much poorer rescue; at 1/20 the patient’s hepatocytes decline to 30% and survival is in doubt. The dashed red curves and the blue dashed curves show the time courses of liver GSH and functional hepatocytes corresponding to the dosing protocols 2 and 3 as described in the text. In these protocols, the NAC dose is spread out over time. Protocol 3 is better than protocol 2, which is better than protocol 1.
Figure 13
Figure 13
Predicted death or recovery. Each dot represents one patient (who did not receive a liver transplant) and it is plotted so that the x coordinate is the dosage estimated by Remien et al. [10] and the y coordinate is the time since the dose estimated by Remien et al. [10]. Death or recovery is indicated by red or blue, respectively. We indicate the curve of hepatocyte depletion to 35% of normal (light grey), 30% of normal (medium grey), and 25% of normal (dark grey). If we use the 30% curve as the boundary between predicted death and predicted recovery, then we incorrectly predict only 3 deaths and 2 recoveries.

Similar articles

Cited by

References

    1. Daly FF, Fountain JS, Murray L, Graudins A, Buckley NA. Guidelines for the management of paracetamol poisoning in Australia and New Zealand - explanation and elaboration. Med J Aus. 2008;188(5):296–301. - PubMed
    1. Nourjah P, Ahmad SR, Karwoski C, Willy C. Estimates of acetaminophen (paraceatmol)-associated overdoses in the United States. Pharmacopidem Drug Safety. 2006;15:398–405. doi: 10.1002/pds.1191. - DOI - PubMed
    1. Lee WM. Acetaminophen-related acute liver failure in the United States. Heptology Res. 2008;38(supp 1):S3—S8. - PubMed
    1. Prescott L. Kinetics and metabolism of paracetamol and phenacetin. British J Clin Pharmacol. 1980;10:291–298. doi: 10.1111/j.1365-2125.1980.tb01812.x. - DOI - PMC - PubMed
    1. Schilling A, Corey R, Eghtesad B, Leonard M. Acetaminophen: old drug, new warnings. Cleveland Clin J Med. 2010;77:19–27. doi: 10.3949/ccjm.77a.09084. - DOI - PubMed

Publication types

MeSH terms

LinkOut - more resources