Review
. 2013 Jan;76(1):016601.
doi: 10.1088/0034-4885/76/1/016601. Epub 2012 Dec 18.

Single-molecule nanometry for biological physics

Affiliations
Review

Single-molecule nanometry for biological physics

Hajin Kim et al. Rep Prog Phys. 2013 Jan.

Abstract

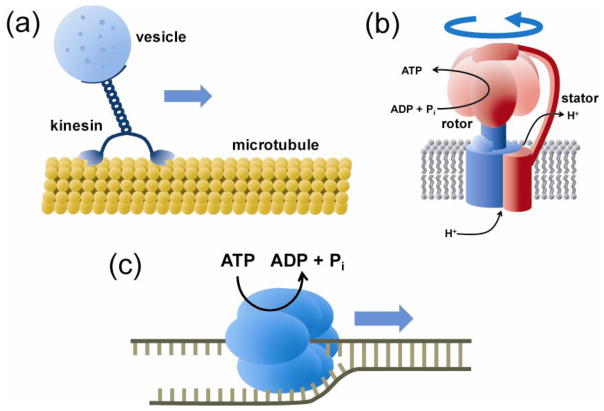
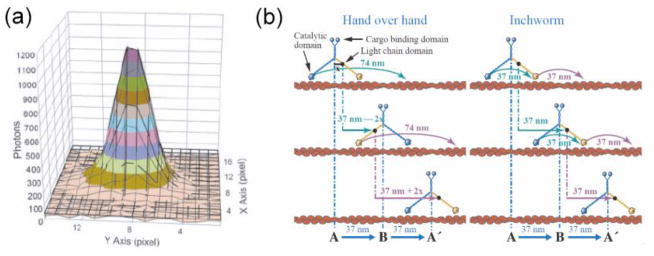
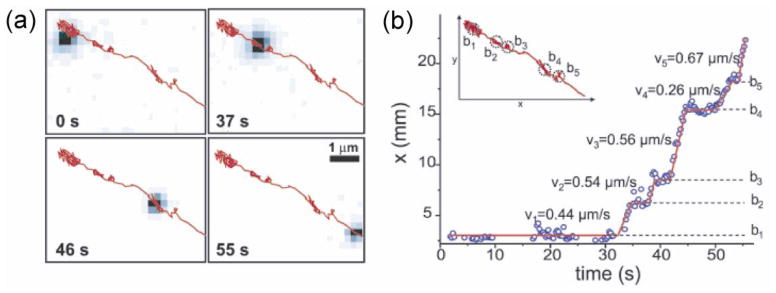
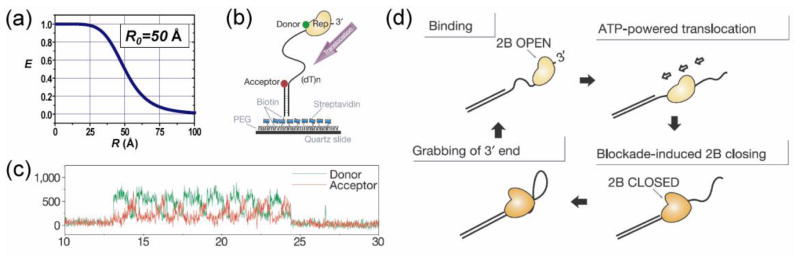
Precision measurement is a hallmark of physics but the small length scale (∼nanometer) of elementary biological components and thermal fluctuations surrounding them challenge our ability to visualize their action. Here, we highlight the recent developments in single-molecule nanometry where the position of a single fluorescent molecule can be determined with nanometer precision, reaching the limit imposed by the shot noise, and the relative motion between two molecules can be determined with ∼0.3 nm precision at ∼1 ms time resolution, as well as how these new tools are providing fundamental insights into how motor proteins move on cellular highways. We will also discuss how interactions between three and four fluorescent molecules can be used to measure three and six coordinates, respectively, allowing us to correlate the movements of multiple components. Finally, we will discuss recent progress in combining angstrom-precision optical tweezers with single-molecule fluorescent detection, opening new windows for multi-dimensional single-molecule nanometry for biological physics.


Figures

Figure 1
Figure 1
Biological motors. (a) Cytoskeleton motors move along a one-dimensional filament of actins or tubulins. Shown is a kinesin carrying a vesicle cargo along a microtubule track. (b) Rotary motors couple biochemical reactions to rotary motion. For example, F0F1-ATP synthase converts a proton gradient across a membrane into the chemical energy by synthesizing ATP or vice versa. (c) Various motors, including DNA/RNA polymerase, helicase, and ribosome, move along nucleic acids to polymerize biopolymers or to change their geometric conformations. A helicase which unwinds double stranded DNA or RNA into single strands is shown.
Figure 2
Figure 2
Localization of a single fluorophore and suggested mechanism for the stepping motion of myosin (Yildiz et al., 2003). (a) Gaussian fitting (solid lines) of the image of a single fluorophore immobilized on surface. While the width of the distribution is 287 nm, the center can be determined to 1.3 nm accuracy. (b) Two possible stepping mechanisms of myosin V. Both mechanisms give the same step size of the center of mass but individual arm will give different step sizes.
Figure 3
Figure 3
Tracking of kinesin by quantum-dot labels (Courty et al., 2006b). (a) Tracking of a quantum-dot-labeled kinesin inside a living cell. Images at different time points are shown with the overall trajectory overlaid in red. (b) Inset: trajectory of the kinesin shown in (a). The position along x axis vs time demonstrates successive directed movements (with corresponding velocities vi) and diffusive motions (marked by bi).
Figure 4
Figure 4
smFRET as a technique to study the dynamics of helicases (Myong et al., 2005). (a) Theoretical distance dependence of FRET efficiency. (b) Schematic of a donor-labeled helicase bound to a single stranded DNA. FRET between the donor and the acceptor on the end of the single stranded region can be used to study helicase translocation. (c) Fluorescence signal abruptly increases when the donor-labeled protein binds to the DNA (~13 s). This is followed by repetitive cycles of gradual FRET increase followed by an abrupt FRET decrease as indicated by anti-correlated changes of donor and acceptor intensities until the signal disappears due to donor photobleaching or protein dissociation. (d) Schematic model on the repetitive shuttling of the helicase on the same segment of single stranded DNA.
Figure 5
Figure 5
Model and experimental observation of tRNA accommodation in the ribosome. (a) A revised model of two-staged tRNA selection (initial selection and proofreading step that follows GTP hydrolysis) based on smFRET experiments (Blanchard et al., 2004). (b) Time evolution of FRET after the initial binding of cognate correct tRNA when GTP hydrolysis is allowed so that both stages of tRNA selection can occur (Blanchard et al., 2004). (c) Time evolution of FRET comparing the delivery of correct (left) and nearly correct (right) tRNAs stalled by non-hydrolizable GTP analog, GDPNP, so that only the initial selection can occur. Both the mid-FRET and low-FRET efficiencies are higher for the correct tRNA by significant amount, suggesting that the tRNA selection has high fidelity even before GTP hydrolysis (Lee et al., 2007c).
Figure 6
Figure 6
Measuring distance changes with one dye (Hwang et al., 2011). (a) Calibration of PIFE (protein induced fluorescence enhancement) effect as a function of distance obtained from exemplary proteins: restriction enzyme, BamHI, and a motor protein RIG-I, and comparison to FRET vs distance. (b) As RIG-I translocates on RNA-DNA duplex, fluorescence signal of a fluorophore attached to one end of the duplex changes, decreasing as the protein moves away from the fluorophore. (c) A single molecule fluorescence intensity time trace showing repetitive translocation of RIG-I observed via PIFE. (d) Time traces averaged over about 50 translocation cycles over duplexes of 20, 30, and 40 base pairs in length.
Figure 7
Figure 7
Three and four color FRET (Lee et al., 2010a). (a) Schematic of 4-color FRET setup with shutters for alternating excitation. (b) Diagram of energy transfer between 4 dyes. With alternating excitation, it is possible to determine all six pairwise distances between the dyes. (c) Strand exchange by RecA filament demonstrated in real time by 4-color FRET. Simultaneously observing two pairs of dyes revealed various types of exchanging mechanism, depending on which part of the DNA strand initializes the exchange.
Figure 8
Figure 8
Combination of fluorescence and force measurements. (a) Schematic of the instrument design combining optical tweezers and confocal fluorescence measurement of two colors (Zhou et al., 2010). (b) Experimental scheme for measuring force-dependence of conformational dynamics of a DNA structure via FRET (Joo et al., 2008).

References

    1. Andrecka J, Lewis R, Brückner F, Lehmann E, Cramer P, Michaelis J. Single-molecule tracking of mRNA exiting from RNA polymerase II. Proceedings of the National Academy of Sciences. 2008;105:135–40. - PMC - PubMed
    1. Badali D, Gradinaru CC. The effect of Brownian motion of fluorescent probes on measuring nanoscale distances by F[o-umlaut]rster resonance energy transfer. The Journal of Chemical Physics. 2011;134:225102–11. - PubMed
    1. Bannai H, Levi S, Schweizer C, Dahan M, Triller A. Imaging the lateral diffusion of membrane molecules with quantum dots. Nat Protocols. 2007;1:2628–34. - PubMed
    1. Bates M, Blosser TR, Zhuang X. Short-Range Spectroscopic Ruler Based on a Single-Molecule Optical Switch. Physical Review Letters. 2005;94:108101. - PMC - PubMed
    1. Benítez JJ, Keller AM, Ochieng P, Yatsunyk LA, Huffman DL, Rosenzweig AC, Chen P. Probing Transient Copper Chaperone – Wilson Disease Protein Interactions at the Single-Molecule Level with Nanovesicle Trapping. Journal of the American Chemical Society. 2008;130:2446–7. - PMC - PubMed

Publication types

MeSH terms

LinkOut - more resources