

Targeting of TGFβ signature and its essential component CTGF by miR-18 correlates with improved survival in glioblastoma
- PMID: 23249750
- PMCID: PMC3543081
- DOI: 10.1261/rna.036467.112
Targeting of TGFβ signature and its essential component CTGF by miR-18 correlates with improved survival in glioblastoma
Abstract
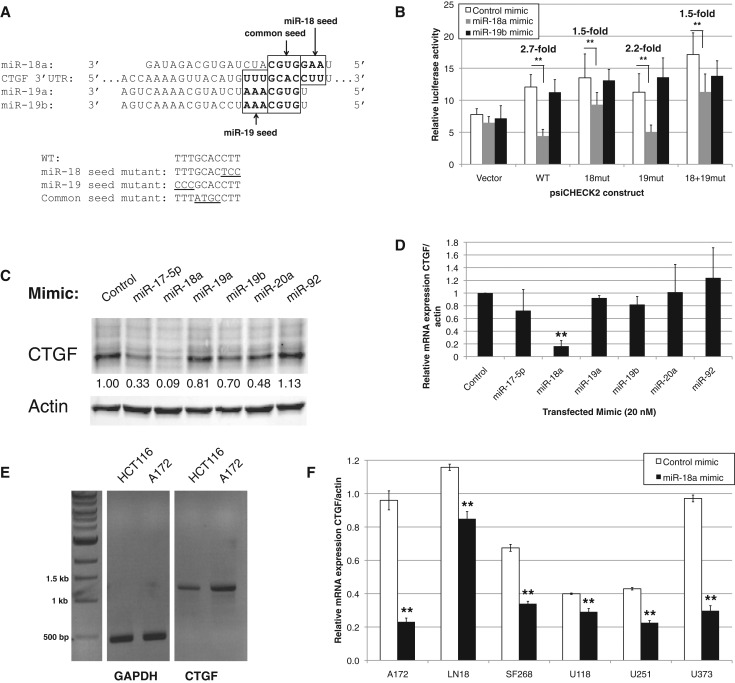
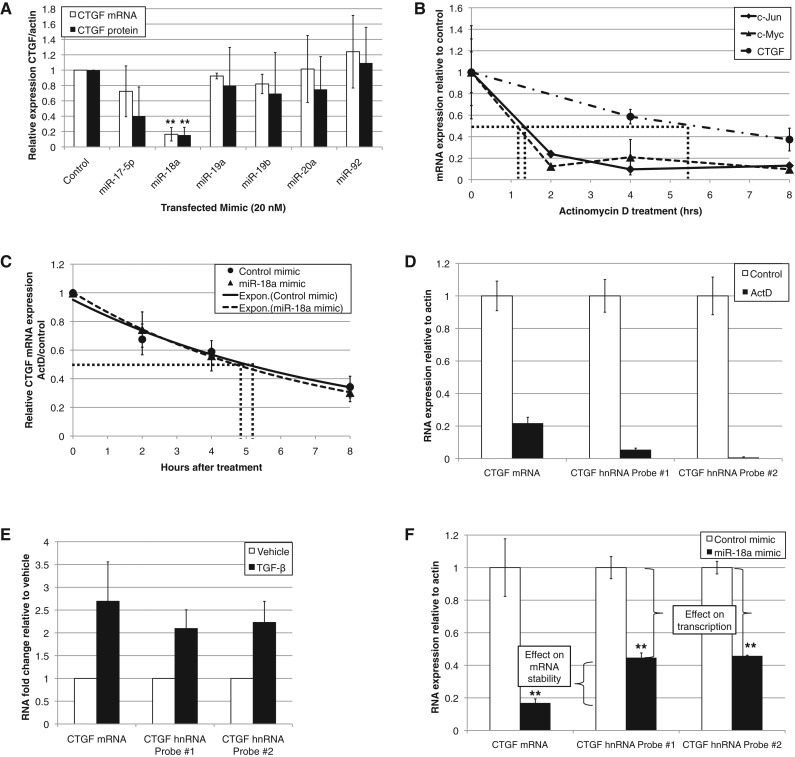
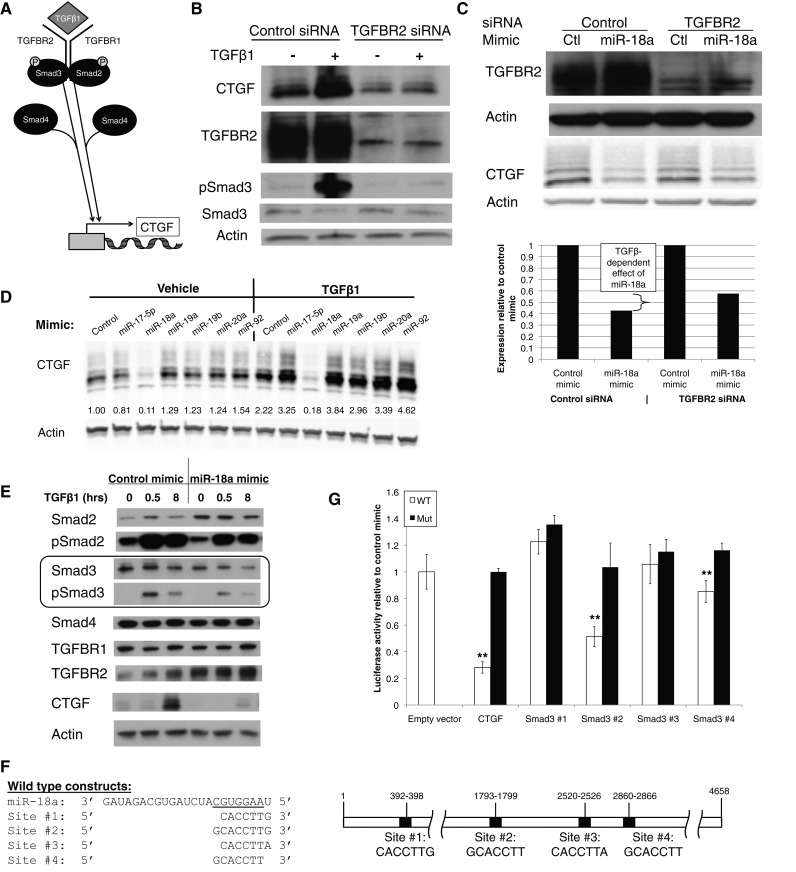
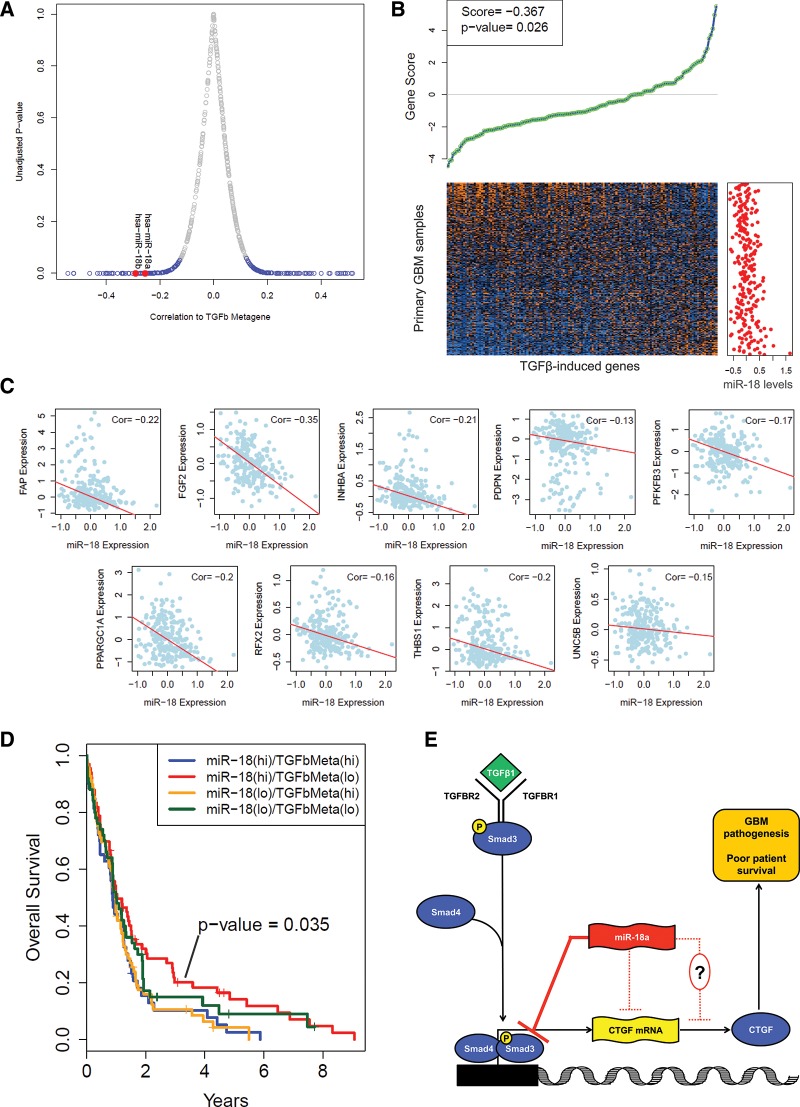
The miR-17∼92 cluster is thought to be an oncogene, yet its expression is low in glioblastoma multiforme (GBM) cell lines. This could allow unfettered expression of miR-17∼92 target genes such as connective tissue growth factor (CTGF; or CCN2), which is known to contribute to GBM pathogenesis. Indeed, microRNA-18a (but not other miR-17∼92 members) has a functional site in the CTGF 3' UTR, and its forced reexpression sharply reduces CTGF protein and mRNA levels. Interestingly, it also reduces the levels of CTGF primary transcript. The unexpected effects of miR-18a on CTGF transcription are mediated in part by direct targeting of Smad3 and ensuing weakening of TGFβ signaling. Having defined the TGFβ signature in GBM cells, we demonstrate a significant anti-correlation between miR-18 and TGFβ signaling in primary GBM samples from The Cancer Genome Atlas. Most importantly, high levels of miR-18 combined with low levels of the TGFβ metagene correlate with prolonged patient survival. Thus, low expression of the miR-17∼92 cluster, and specifically miR-18a, could significantly contribute to GBM pathogenesis.
Figures
Similar articles
-
MicroRNA-145 is downregulated in glial tumors and regulates glioma cell migration by targeting connective tissue growth factor.PLoS One. 2013;8(2):e54652. doi: 10.1371/journal.pone.0054652. Epub 2013 Feb 4. PLoS One. 2013. PMID: 23390502 Free PMC article.
-
Connective tissue growth factor (CTGF/CCN2) is negatively regulated during neuron-glioblastoma interaction.PLoS One. 2013;8(1):e55605. doi: 10.1371/journal.pone.0055605. Epub 2013 Jan 31. PLoS One. 2013. PMID: 23383241 Free PMC article.
-
HBX Protein-Induced Downregulation of microRNA-18a is Responsible for Upregulation of Connective Tissue Growth Factor in HBV Infection-Associated Hepatocarcinoma.Med Sci Monit. 2016 Jul 16;22:2492-500. doi: 10.12659/msm.895943. Med Sci Monit. 2016. PMID: 27421245 Free PMC article.
-
MicroRNA-21 promotes glioblastoma tumorigenesis by down-regulating insulin-like growth factor-binding protein-3 (IGFBP3).J Biol Chem. 2014 Sep 5;289(36):25079-87. doi: 10.1074/jbc.M114.593863. Epub 2014 Jul 24. J Biol Chem. 2014. PMID: 25059666 Free PMC article.
-
Runx2/Smad3 complex negatively regulates TGF-β-induced connective tissue growth factor gene expression in vascular smooth muscle cells.J Atheroscler Thromb. 2012;19(1):23-35. doi: 10.5551/jat.9753. Epub 2011 Oct 8. J Atheroscler Thromb. 2012. PMID: 21986102
Cited by
-
MicroRNA-18a promotes cancer progression through SMG1 suppression and mTOR pathway activation in nasopharyngeal carcinoma.Cell Death Dis. 2019 Oct 28;10(11):819. doi: 10.1038/s41419-019-2060-9. Cell Death Dis. 2019. PMID: 31659158 Free PMC article.
-
Systematic analysis of metastasis-associated genes identifies miR-17-5p as a metastatic suppressor of basal-like breast cancer.Breast Cancer Res Treat. 2014 Aug;146(3):487-502. doi: 10.1007/s10549-014-3040-5. Epub 2014 Jul 8. Breast Cancer Res Treat. 2014. PMID: 25001613 Free PMC article.
-
CCN2 (Cellular Communication Network factor 2) in the bone marrow microenvironment, normal and malignant hematopoiesis.J Cell Commun Signal. 2021 Mar;15(1):25-56. doi: 10.1007/s12079-020-00602-2. Epub 2021 Jan 11. J Cell Commun Signal. 2021. PMID: 33428075 Free PMC article. Review.
-
Next generation sequencing analysis of miRNAs: MiR-127-3p inhibits glioblastoma proliferation and activates TGF-β signaling by targeting SKI.OMICS. 2014 Mar;18(3):196-206. doi: 10.1089/omi.2013.0122. Epub 2014 Feb 11. OMICS. 2014. PMID: 24517116 Free PMC article.
-
Connective tissue growth factor as an unfavorable prognostic marker promotes the proliferation, migration, and invasion of gliomas.Chin Med J (Engl). 2020 Mar 20;133(6):670-678. doi: 10.1097/CM9.0000000000000683. Chin Med J (Engl). 2020. PMID: 32197031 Free PMC article.
References
-
- Amagasaki K, Sasaki A, Kato G, Maeda S, Nukui H, Naganuma H 2001. Antisense-mediated reduction in thrombospondin-1 expression reduces cell motility in malignant glioma cells. Int J Cancer 94: 508–512 - PubMed
-
- Baxter RC, Twigg SM 2009. Actions of IGF binding proteins and related proteins in adipose tissue. Trends Endocrinol Metab 20: 499–505 - PubMed
Publication types
MeSH terms
Substances
Grants and funding
LinkOut - more resources
Full Text Sources
Miscellaneous