

Monitoring intracellular redox changes in ozone-exposed airway epithelial cells
- PMID: 23249900
- PMCID: PMC3621206
- DOI: 10.1289/ehp.1206039
Monitoring intracellular redox changes in ozone-exposed airway epithelial cells
Abstract
Background: The toxicity of many xenobiotic compounds is believed to involve oxidative injury to cells. Direct assessment of mechanistic events involved in xenobiotic-induced oxidative stress is not easily achievable. Development of genetically encoded probes designed for monitoring intracellular redox changes represents a methodological advance with potential applications in toxicological studies.
Objective: We tested the utility of redox-sensitive green fluorescent protein (roGFP)-based redox sensors for monitoring real-time intracellular redox changes induced by xenobiotics in toxicological studies.
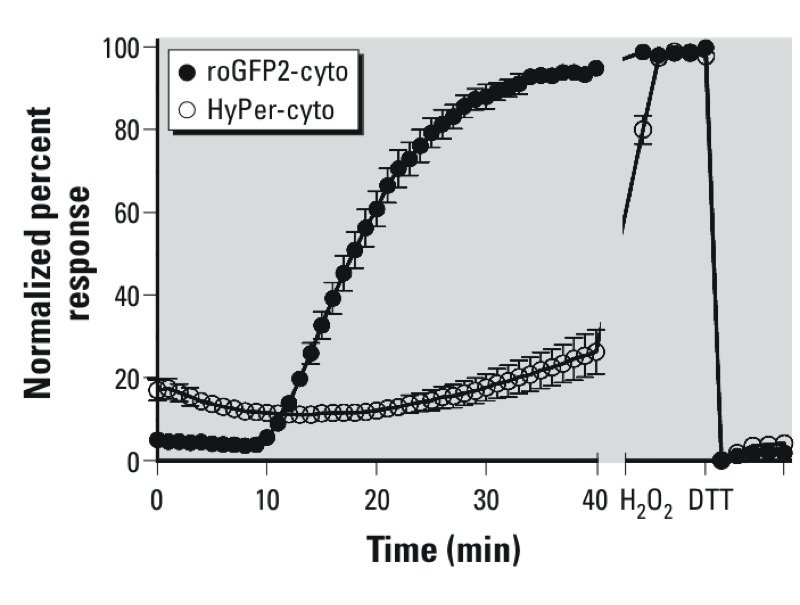
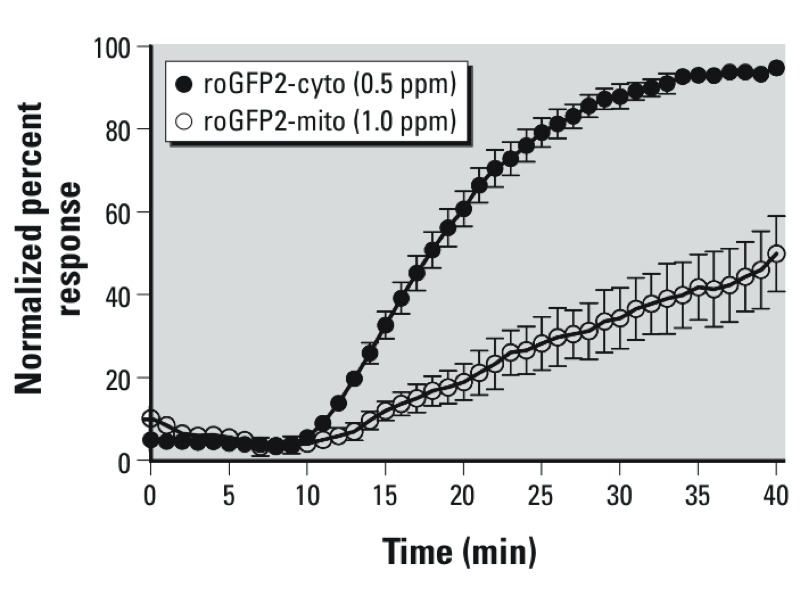
Methods: roGFP2, a reporter of the glutathione redox potential (E(GSH)), was used to monitor EGSH in cultured human airway epithelial cells (BEAS-2B cells) undergoing exposure to 0.15-1.0 ppm ozone (O(3)). Cells were imaged in real time using a custom-built O(3) exposure system coupled to a confocal microscope.
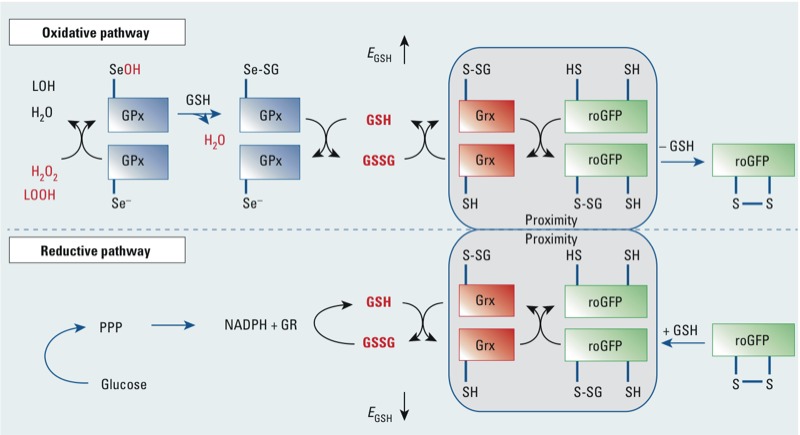
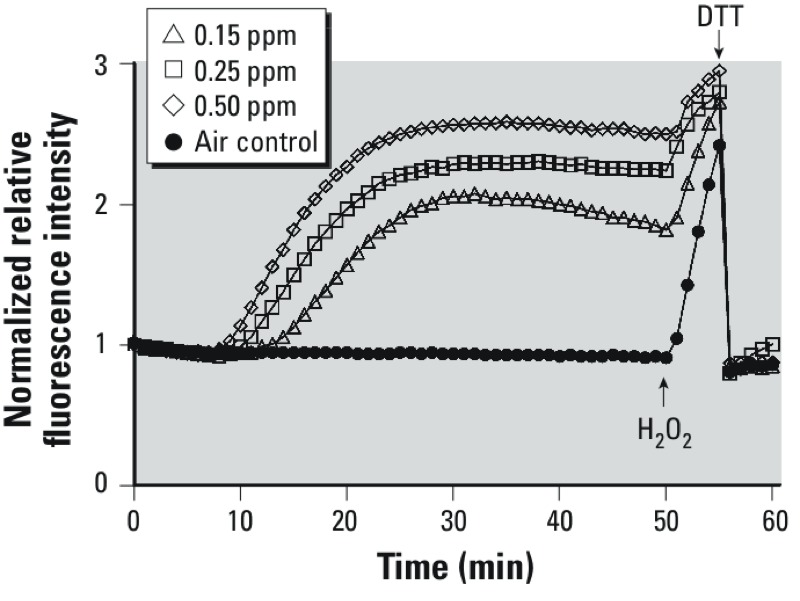
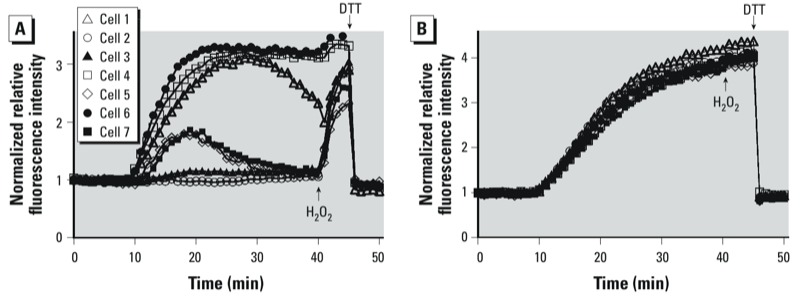
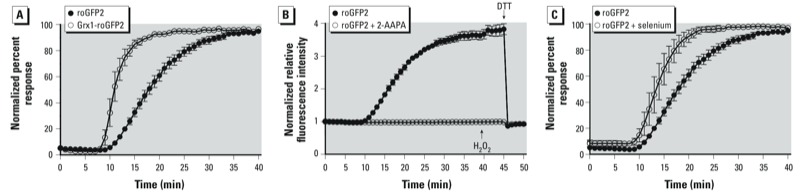
Results: O(3) exposure induced a dose- and time-dependent increase of the cytosolic EGSH. Additional experiments confirmed that roGFP2 is not directly oxidized, but properly equilibrates with the glutathione redox couple: Inhibition of endogenous glutaredoxin 1 (Grx1) disrupted roGFP2 responses to O(3), and a Grx1-roGFP2 fusion protein responded more rapidly to O(3) exposure. Selenite-induced up-regulation of GPx (glutathione peroxidase) expression-enhanced roGFP2 responsiveness to O(3), suggesting that (hydro)peroxides are intermediates linking O(3) exposure to glutathione oxidation.
Conclusion: Exposure to O(3) induces a profound increase in the cytosolic E(GSH) of airway epithelial cells that is indicative of an oxidant-dependent impairment of glutathione redox homeostasis. These studies demonstrate the utility of using genetically encoded redox reporters in making reliable assessments of cells undergoing exposure to xenobiotics with strong oxidizing properties.
Conflict of interest statement
The authors declare they have no actual or potential competing financial interests.
Figures
Similar articles
-
Real-time imaging of the intracellular glutathione redox potential in the malaria parasite Plasmodium falciparum.PLoS Pathog. 2013;9(12):e1003782. doi: 10.1371/journal.ppat.1003782. Epub 2013 Dec 5. PLoS Pathog. 2013. PMID: 24348249 Free PMC article.
-
Redox-sensitive GFP in Arabidopsis thaliana is a quantitative biosensor for the redox potential of the cellular glutathione redox buffer.Plant J. 2007 Dec;52(5):973-86. doi: 10.1111/j.1365-313X.2007.03280.x. Epub 2007 Sep 22. Plant J. 2007. PMID: 17892447
-
Live Monitoring of ROS-Induced Cytosolic Redox Changes with roGFP2-Based Sensors in Plants.Methods Mol Biol. 2022;2526:65-85. doi: 10.1007/978-1-0716-2469-2_5. Methods Mol Biol. 2022. PMID: 35657512
-
Mechanisms and Applications of Redox-Sensitive Green Fluorescent Protein-Based Hydrogen Peroxide Probes.Antioxid Redox Signal. 2018 Aug 20;29(6):552-568. doi: 10.1089/ars.2017.7449. Epub 2018 Jan 10. Antioxid Redox Signal. 2018. PMID: 29160083 Review.
-
Genetically encoded fluorescent redox sensors.Biochim Biophys Acta. 2014 Feb;1840(2):745-56. doi: 10.1016/j.bbagen.2013.05.030. Epub 2013 May 29. Biochim Biophys Acta. 2014. PMID: 23726987 Review.
Cited by
-
Exposure Effects Beyond the Epithelial Barrier: Transepithelial Induction of Oxidative Stress by Diesel Exhaust Particulates in Lung Fibroblasts in an Organotypic Human Airway Model.Toxicol Sci. 2020 Sep 1;177(1):140-155. doi: 10.1093/toxsci/kfaa085. Toxicol Sci. 2020. PMID: 32525552 Free PMC article.
-
GAPDH inhibition mediated by thiol oxidation in human airway epithelial cells exposed to an environmental peroxide.Redox Biol. 2024 Jul;73:103199. doi: 10.1016/j.redox.2024.103199. Epub 2024 May 17. Redox Biol. 2024. PMID: 38810423 Free PMC article.
-
Imaging Approaches to Assessments of Toxicological Oxidative Stress Using Genetically-encoded Fluorogenic Sensors.J Vis Exp. 2018 Feb 7;(132):56945. doi: 10.3791/56945. J Vis Exp. 2018. PMID: 29443110 Free PMC article.
-
Role of H2O2 in the oxidative effects of zinc exposure in human airway epithelial cells.Redox Biol. 2014;3:47-55. doi: 10.1016/j.redox.2014.10.005. Epub 2014 Oct 31. Redox Biol. 2014. PMID: 25462065 Free PMC article.
-
Supplementation with omega-3 fatty acids potentiates oxidative stress in human airway epithelial cells exposed to ozone.Environ Res. 2020 Aug;187:109627. doi: 10.1016/j.envres.2020.109627. Epub 2020 May 11. Environ Res. 2020. PMID: 32417507 Free PMC article.
References
-
- Anderson ME. Glutathione: an overview of biosynthesis and modulation. Chem Biol Interact. 1998;111–112:1–14. - PubMed
-
- Ballinger CA, Cueto R, Squadrito G, Coffin JF, Velsor LW, Pryor WA, et al. Antioxidant-mediated augmentation of ozone-induced membrane oxidation. Free Radic Biol Med. 2005;38:515–526. - PubMed
-
- Bargagli E, Olivieri C, Bennett D, Prasse A, Muller-Quernheim J, Rottoli P. Oxidative stress in the pathogenesis of diffuse lung diseases: a review. Respir Med. 2009;103:1245–1256. - PubMed
Publication types
MeSH terms
Substances
Grants and funding
LinkOut - more resources
Full Text Sources
Other Literature Sources
Medical
