. 2013 Jan 15;140(2):313-22.
doi: 10.1242/dev.086900.

Bioelectric signaling regulates head and organ size during planarian regeneration

Affiliations

Bioelectric signaling regulates head and organ size during planarian regeneration

Wendy Scott Beane et al. Development. .

Abstract

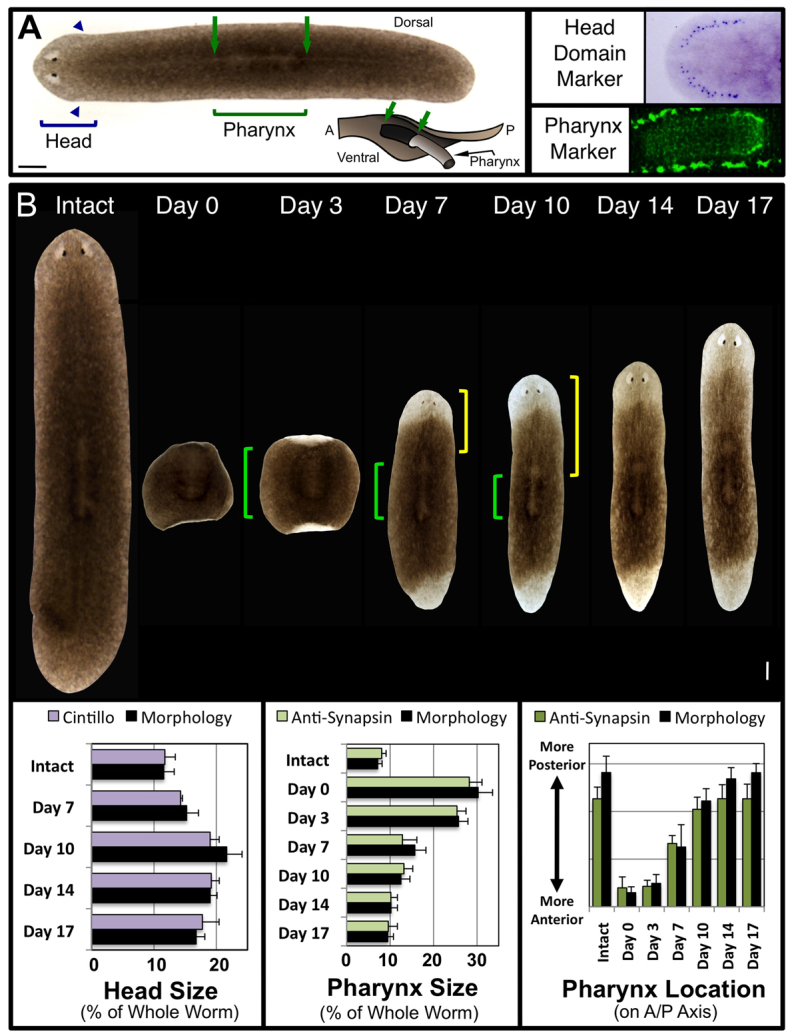
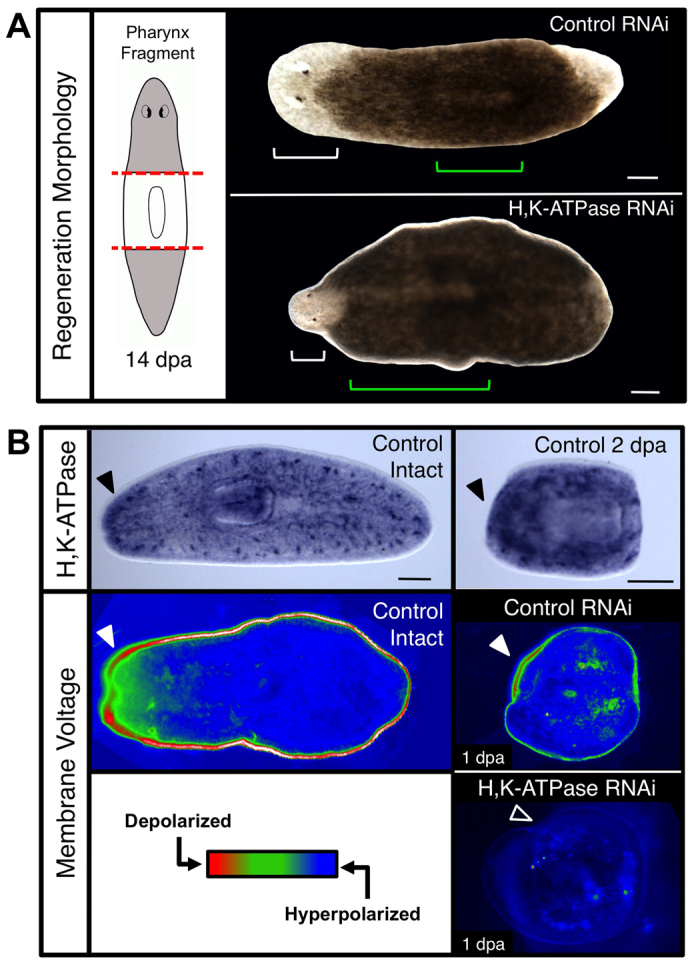
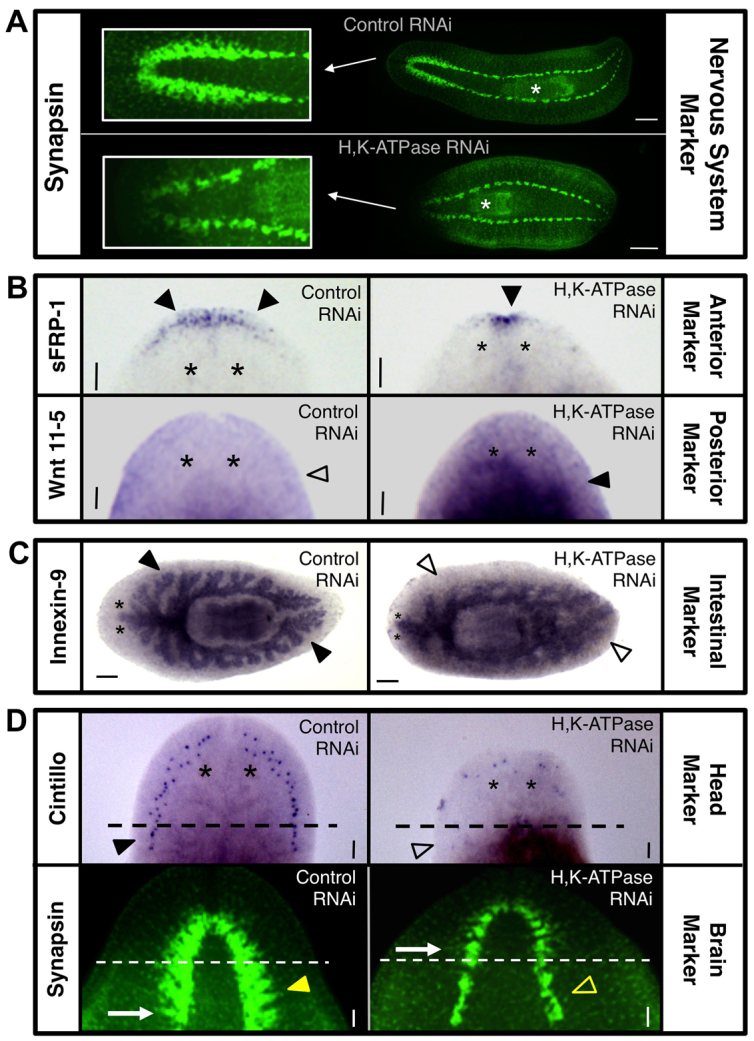
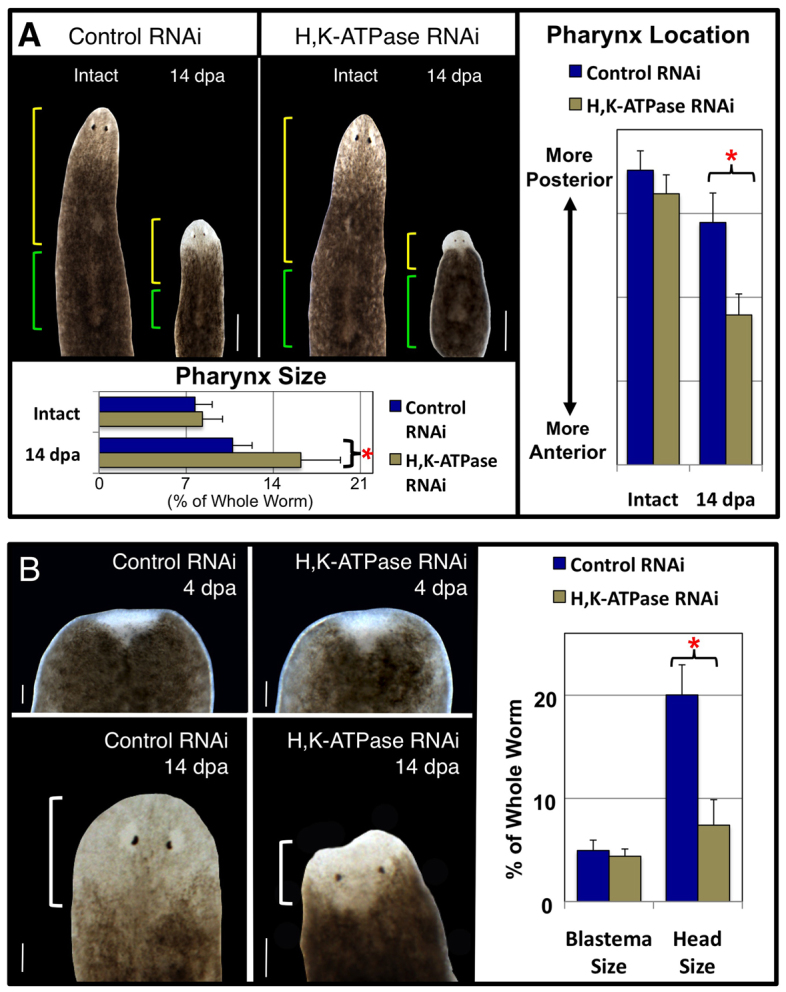
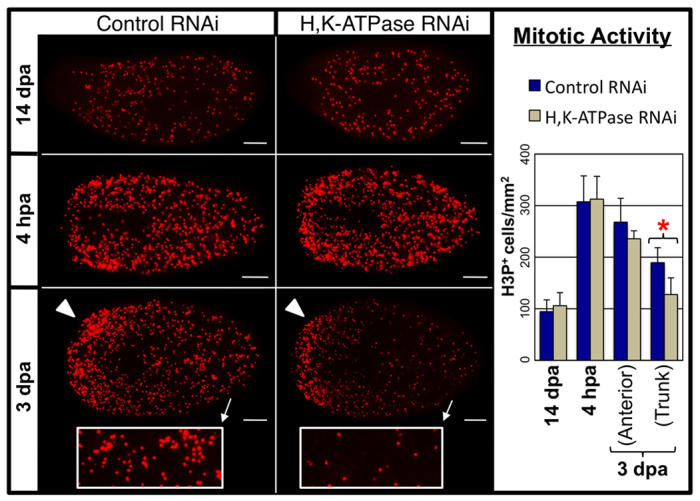
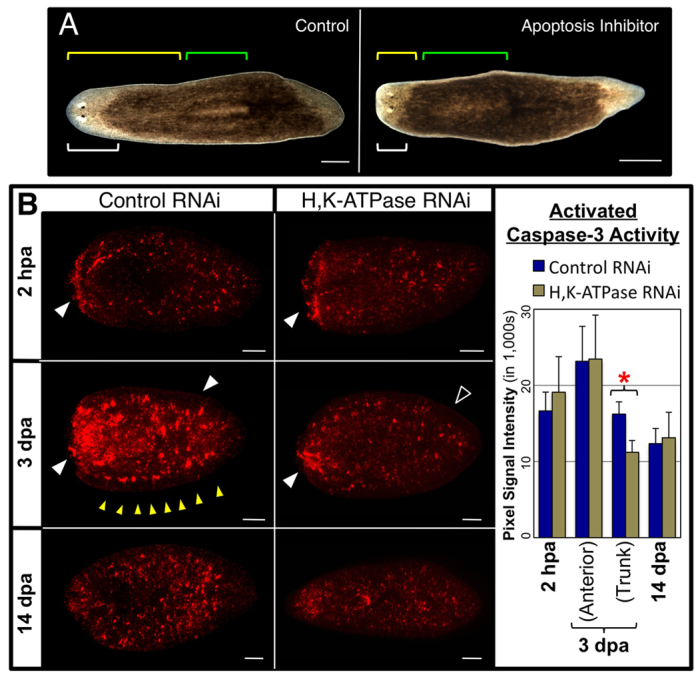
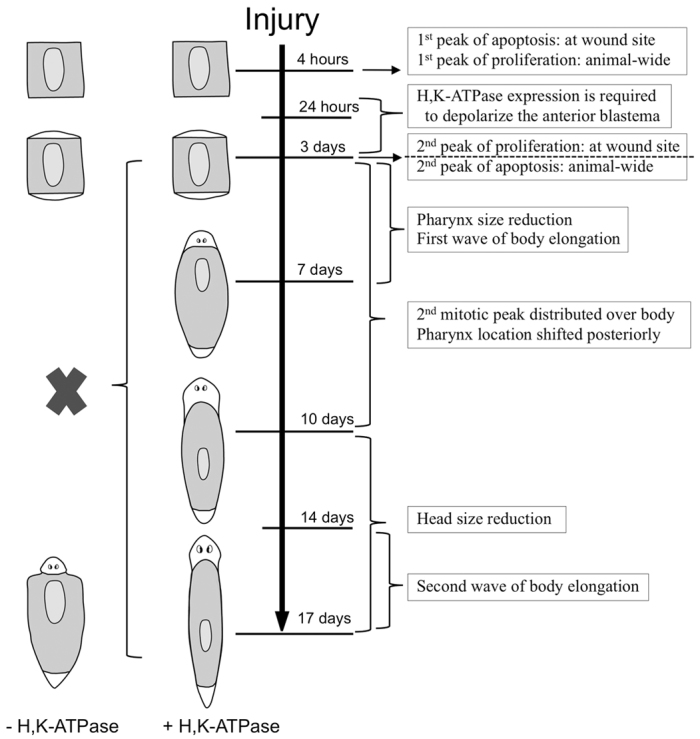
A main goal of regenerative medicine is to replace lost or damaged tissues and organs with functional parts of the correct size and shape. But the proliferation of new cells is not sufficient; we will also need to understand how the scale and ultimate form of newly produced tissues are determined. Using the planarian model system, we report that membrane voltage-dependent bioelectric signaling determines both head size and organ scaling during regeneration. RNA interference of the H(+),K(+)-ATPase ion pump results in membrane hyperpolarization, which has no effect on the amount of new tissue (blastema) that is regenerated yet produces regenerates with tiny 'shrunken' heads and proportionally oversized pharynges. Our data show that this disproportionality results from a lack of the apoptosis required to adjust head and organ size and placement, highlighting apoptotic remodeling as the link between bioelectric signaling and the establishment of organ size during regeneration.


Figures

Fig. 1.
Fig. 1.
Characterization of tissue remodeling during planarian regeneration. (A) Intact S. mediterranea. Brackets: regions used for morphological analyses. Posterior boundary of the head marked by the auricles (arrowheads). Pharynx dorsally viewed as a lightly pigmented region outlined by a ring of darker pigment (arrows). Inset: diagram of pharynx extended through ventral pharyngeal opening (A, anterior; P, posterior). Molecular markers: head domain, Smed-cintillo; pharynx, anti-synapsin (pharyngeal nerve plexus bordered top and bottom by the ventral nerve cords). Anterior is left. (B) Composite image of regeneration over 17 days in a single planarian pharynx regenerate (amputated just anterior and posterior to the pharynx). Green brackets, pharynx; yellow brackets, distance between pharynx and tip of the head (pharynx location on the A/P axis). Anterior is up. Quantification of tissue remodeling by both morphological and molecular analyses (in the same regenerates over time for morphology) are shown below. Error bars: s.d. (n≥10). Scale bar: 200 μm.
Fig. 2.
Fig. 2.
The H,K-ATPase ion pump regulates membrane voltage and regenerative scaling. (A) Pharynx fragments at 14 dpa following H,K-ATPase inhibition by RNAi. Red dashed lines, amputation planes; white brackets, head; green brackets, pharynx. Shrunken head phenotype: 91.6%. n≥125. (B) H,K-ATPase expression leads to membrane depolarization in intact worms and pharynx regenerates. Top: In situ hybridization showing Smed-H,K-ATPase expression, n>5. Black arrowheads denote upregulated anterior expression. Middle and bottom: Membrane voltage reporter assay using DiBAC4(3), n>10. Red, relatively depolarized; blue, relatively hyperpolarized. Filled arrowheads denote presence and unfilled arrowhead absence of anterior depolarization. Anterior is left. Scale bars: 200 μm.
Fig. 3.
Fig. 3.
H,K-ATPase is required for remodeling tissue identities during regeneration. Marker analyses in 14 dpa pharynx regenerates (unless otherwise noted). (A) Nervous system analysis by anti-synapsin labeling (n=10). Insets: closeup of brain. White asterisks indicate pharynx. (B) Anterior-posterior polarity analyses of head region (n≥7). Anterior marker: sFRP-1. Posterior marker: Wnt 11-5. Filled arrowheads denote presence and unfilled arrowhead absence of expression. (C) Intestinal tract analysis by Innexin-9 staining (n≥6). Filled arrowheads denote presence and unfilled arrowheads absence of tertiary intestinal branching. (D) Analyses of new tissue versus pre-existing tissue gene expression (n≥9). Head domain marker: cintillo. Average number of cintillo dots: 40.2 (control), 13.7 (H,K-ATPase RNAi), P<0.0001. Brain marker: synapsin (10 dpa). Dashed lines: amputation plane. Filled arrowhead denotes presence and unfilled arrowhead absence of expression in pre-existing tissues. Arrows indicate posterior-most brain branch. Anterior: left (A,C) or up (B,D). White asterisks: pharynx. Black asterisks indicate position of eyes. Scale bars: in A, 200 μm; in C, 100 μm; in B,D, 50 μm.
Fig. 4.
Fig. 4.
H,K-ATPase inhibition prevents tissue remodeling without affecting blastema growth. (A) Pharynx remodeling during regeneration. The same planarian shown before amputation and as a 14 dpa pharynx regenerate (composite image). Green brackets, pharynx; yellow brackets, pharynx location on the A/P axis. Average pharynx size: 7.7% (control intact), 8.3% (H,K-ATPase RNAi intact), 10.7% (control 14 dpa), 16.2% (H,K-ATPase RNAi 14 dpa). (B) Head remodeling during regeneration. The same tail regenerate (amputated just once posterior to the pharynx) is shown at 4 dpa (top panels) and at 14 dpa (bottom panels). Average blastema size at 4 dpa: 4.9% (control), 4.5% (H,K-ATPase RNAi). Average head size at 14 dpa: 20% (control), 7.5% (H,K-ATPase RNAi). White brackets, head. Anterior is up. *P<0.0001. Error bars: s.d. (n≥14). Scale bars: in A, 400 μm; in B, 100 μm.
Fig. 5.
Fig. 5.
H,K-ATPase does not regulate blastema-associated proliferation. Mitotic activity detected by anti-phosphorylated histone H3 (H3P) labeling (headless regenerates, amputated once anterior to pharynx). H,K-ATPase does not affect basal levels of proliferation (re-established by 14 dpa), nor upregulated proliferation in the trunk at 4 hpa, nor at the blastema margin (arrowheads) at 3 dpa. However, H,K-ATPase-inhibited regenerates at 3 dpa have reduced proliferation in the trunk (insets; where remodeling of pre-existing tissues occurs). Anterior is left. *P<0.01. Error bars: s.d. (n≥7). Scale bars: 200 μm.
Fig. 6.
Fig. 6.
H,K-ATPase mediates apoptotic tissue remodeling. (A) Pharynx regenerates (14 dpa) treated with the apoptosis inhibitor M50054. White brackets, head; green brackets, pharynx; yellow brackets, pharynx location on the A/P axis. Reduced remodeling: 0% (control), 45% (M50054). n=40. (B) Apoptosis detected by activated caspase-3 labeling (regenerates amputated once anterior to the pharynx). H,K-ATPase inhibition does not affect basal levels of apoptosis (restored by 14 dpa), nor upregulated apoptosis at the wound site at 2 hpa. However, at 3 dpa apoptosis in the trunk (associated with remodeling of existing tissues) is blocked in H,K-ATPase-inhibited regenerates (even though upregulated apoptosis near the blastema is unaffected). Filled white arrowheads indicate the presence and unfilled arrowhead the absence of upregulated apoptotic activity. Yellow arrowheads indicate punctate areas of upregulation at the lateral margin. Anterior is left. *P<0.001. Error bars: s.d. (n≥5). Scale bars: in B, 200 μm; in A, 400 μm.
Fig. 7.
Fig. 7.
Model of H,K-ATPase-mediated tissue remodeling during regeneration. Timeline of events. White tissues, new growth (blastema); shaded tissues, pre-existing tissues. All events below the dashed line are dependent on H,K-ATPase activity (blockade of which is indicated by the black cross).

References

    1. Aboobaker A. A. (2011). Planarian stem cells: a simple paradigm for regeneration. Trends Cell Biol. 21, 304–311 - PubMed
    1. Agata K., Saito Y., Nakajima E. (2007). Unifying principles of regeneration I: Epimorphosis versus morphallaxis. Dev. Growth Differ. 49, 73–78 - PubMed
    1. Beane W. S., Morokuma J., Adams D. S., Levin M. (2011). A chemical genetics approach reveals H,K-ATPase-mediated membrane voltage is required for planarian head regeneration. Chem. Biol. 18, 77–89 - PMC - PubMed
    1. Beane W. S., Tseng A. S., Morokuma J., Lemire J. M., Levin M. (2012). Inhibition of planar cell polarity extends neural growth during regeneration, homeostasis, and development. Stem Cells Dev. 21, 2085–2094 - PMC - PubMed
    1. Bender C. E., Fitzgerald P., Tait S. W., Llambi F., McStay G. P., Tupper D. O., Pellettieri J., Sanchez Alvarado A., Salvesen G. S., Green D. R. (2012). Mitochondrial pathway of apoptosis is ancestral in metazoans. Proc. Natl. Acad. Sci. USA 109, 4904–4909 - PMC - PubMed

Publication types

Substances