. 2012:3:1301.
doi: 10.1038/ncomms2297.

Proteome-wide selected reaction monitoring assays for the human pathogen Streptococcus pyogenes

Affiliations
Free PMC article

Proteome-wide selected reaction monitoring assays for the human pathogen Streptococcus pyogenes

Christofer Karlsson et al. Nat Commun. 2012.
Free PMC article

Abstract

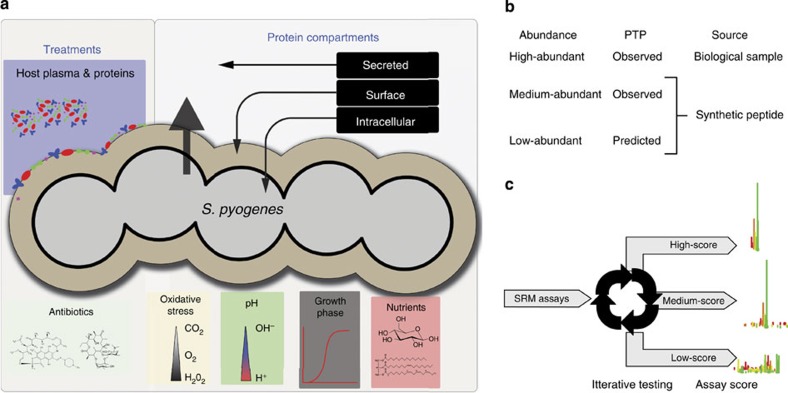
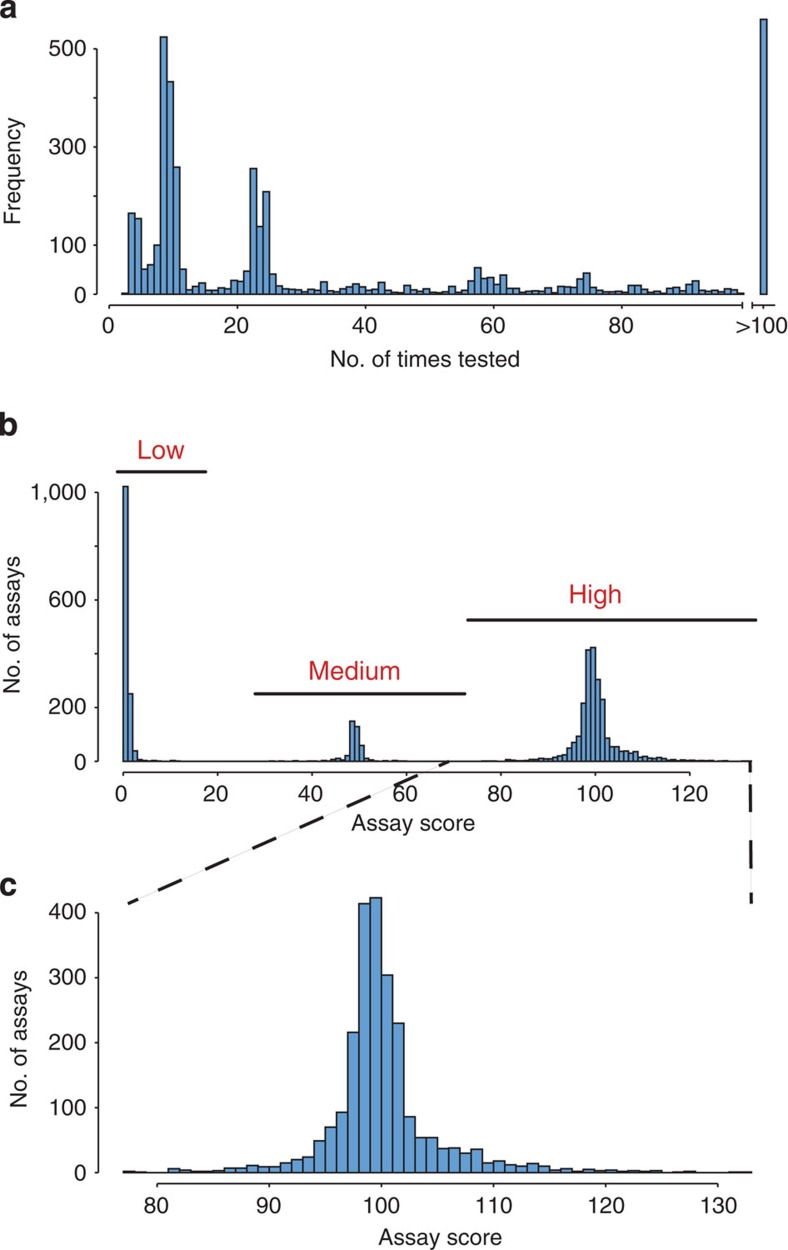
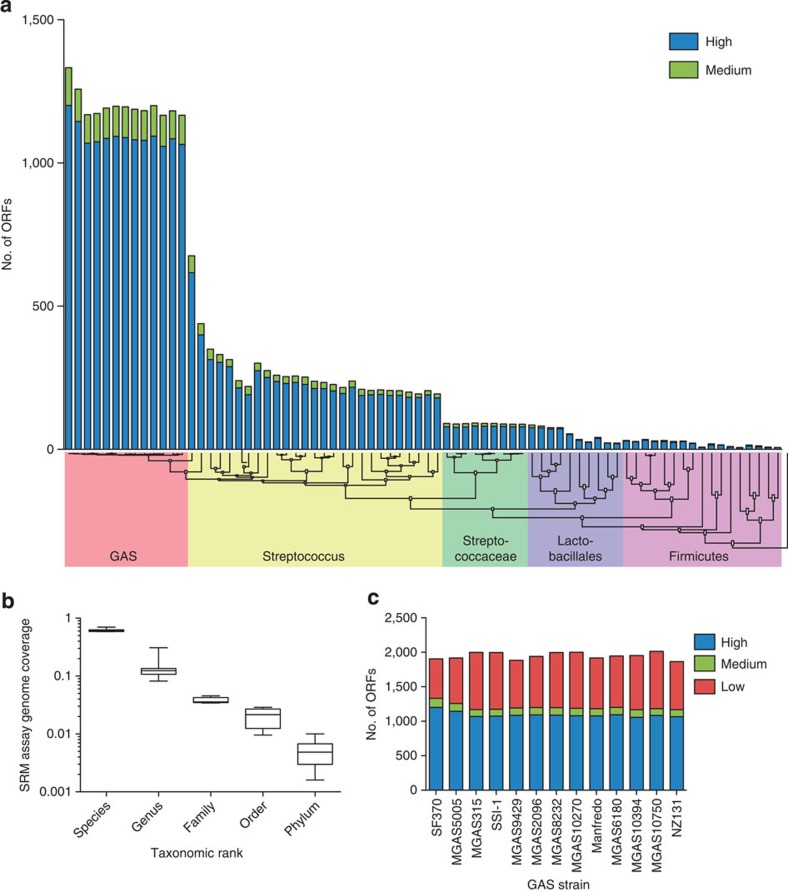
Selected reaction monitoring mass spectrometry (SRM-MS) is a targeted proteomics technology used to identify and quantify proteins with high sensitivity, specificity and high reproducibility. Execution of SRM-MS relies on protein-specific SRM assays, a set of experimental parameters that requires considerable effort to develop. Here we present a proteome-wide SRM assay repository for the gram-positive human pathogen group A Streptococcus. Using a multi-layered approach we generated SRM assays for 10,412 distinct group A Streptococcus peptides followed by extensive testing of the selected reaction monitoring assays in >200 different group A Streptococcus protein pools. Based on the number of SRM assay observations we created a rule-based selected reaction monitoring assay-scoring model to select the most suitable assays per protein for a given cellular compartment and bacterial state. The resource described here represents an important tool for deciphering the group A Streptococcus proteome using selected reaction monitoring and we anticipate that concepts described here can be extended to other pathogens.


Figures

Figure 1
Figure 1. Construction of a proteome-wide SRM assay repository.
(a) Graphical representation of the enriched Group A Streptococci (GAS) cellular compartments. Repeated enrichment of protein pools from the cellular compartments and bacterial states were digested using trypsin and analysed by LC tandem MS (LC–MS/MS). (b) Outline of the strategy used to construct a spectral library from where the low-scoring SRM assays were extracted. For high-abundant PTP’s the SRM assays were determined directly in biological samples, whereas for medium- and low-abundant PTP peptides were synthesized and analysed with LC–MS/MS. (c) To increase the confidence of the individual SRM assays the low-scoring SRM assays were tested extensively in complex mixture of GAS tryptic digest using SRM.
Figure 2
Figure 2. Rule-based assay score modelling can select high performing assays depending on cellular compartment and cellular state.
SRM assays were tested repeatedly in mixtures of GAS tryptic digests from different sub-cellular compartments and bacterial states. (a) Statistics over the repetitive testing of all SRM assays. The y-axis shows the frequency of the number of times a SRM assay was tested. (b) The assays were divided up into three categories, low-, medium- and high-scoring SRM assays based on a rule-based assay score model. In summary, the higher the frequency with which an SRM assay was observed with high probability, the higher the assay score. (c) Assay score distribution for high-scoring SRM assays.
Figure 3
Figure 3. Protein identification biases across functional categories and ORF properties.
Iterative testing of the developed SRM assays in complex biological mixtures of GAS tryptic digests resulted in subdivision of the proteins into three SRM assays-score categories; proteins with low-, medium- or high-scoring SRM assays. Using the SRM assay score categories we determined biases among associated proteins within the three categories. (a) Proportion of XIC intensities associated with proteins with at least one high or medium-scoring SRM assay or proteins with low-scoring SRM assays. NMPDR was used to categorize proteins; protein metabolism includes categories amino acids and derivatives and protein metabolism; miscellaneous includes categories clustering-based sub-systems, miscellaneous, phages, prophages, transposable elements, plasmids, regulation and cell signalling, respiration, stress response, cell division and cell cycle and cell wall and capsule; carbohydrate metabolism includes category carbohydrates; RNA and DNA metabolism includes categories nucleosides and nucleotides, DNA metabolism and RNA metabolism; other metabolism includes categories phosphorus metabolism, potassium metabolism, fatty acids, lipids and isoprenoids, cofactors, vitamins, prosthetic groups and pigments, sulphur metabolism, iron acquisition and metabolism, nitrogen metabolism, membrane transport and metabolism of aromatic compounds virulence includes categories virulence and virulence, disease and defence. (b) Genome-wide correlation between SRM assay score and ORF length. (c) Correlation between SRM assay score and relative degree of protein conservation across 13 GAS strains as determined with TOP-BLAST hits with SF370 as reference.
Figure 4
Figure 4. Spatial distribution of proteins with high-scoring SRM assays.
Testing of all SRM assays in three sub-cellular compartments enabled the construction of a sub-cellular distribution map for the proteins with high-scoring assays. By using k-mean clustering, the expression profiles were split into six different clusters: (a,b) predominately intracellular proteins, (c) surface-associated proteins, (d) secreted proteins and (e,f) proteins with split sub-cellular compartmentalization. Black lines in af represent the relative protein compartment signal and the red lines represent the average distribution of the clusters. Subsequently the identified proteins were grouped into NMPDR sub-systems and visualized using Cytoscape. (g) Outline of the GAS proteome network topology, where circles represent NMPDR sub-systems where all proteins predominantly have the same sub-cellular location, secreted, surface-associated or intracellular, according to the sub-cellular protein profiles in (a,d). Rectangles represent NMPDR sub-systems where an equal number of members have opposing sub-cellular location profiles. The localization of the rectangles in the network is influenced by the edges, which represent protein members that belong to more than one NMPDR sub-system. Increasing node size represents increasing number of member proteins. The colour represents average SRM assay score, where red indicates NMPDR sub-systems with high-average SRM assay score and black indicating NMPDR sub-systems with low average SRM assays score. For full details of NMPDR sub-systems see Supplementary Fig. S1.
Figure 5
Figure 5. SRM assay transportability to related species.
All SRM assays were developed on basis of the GAS strain SF370 genome. The degree of SRM assay transportability within selected species was determined phylogeny clustering of respective rpoB gene and mapping medium- and high-scoring SRM assays on to respective genome. (a) Transportability for the SRM assays across 75 genomes within the Firmicutes phylum. (b) Average ORF genome coverage of high- and medium-scoring SRM assays within taxonomic ranks. Boxes extend from the 25th to 75th percentiles and error bars represent minimum to maximum values. (c) View of SRM assay transportability for 13 GAS genomes deposited in the public domain.

References

    1. Malmström J. A. et al. Streptococcus pyogenes in human plasma: adaptive mechanisms analyzed by mass spectrometry based proteomics. J. Biol. Chem. 287, 1415–1425 (2011). - PMC - PubMed
    1. Hecker M., Becher D., Fuchs S. & Engelmann S. A proteomic view of cell physiology and virulence of Staphylococcus aureus. Int. J. Med. Microbiol. 300, 76–87 (2010). - PubMed
    1. Poetsch A., Haussmann U. & Burkovski A. Proteomics of corynebacteria: from biotechnology workhorses to pathogens. Proteomics 11, 3244–3255 (2011). - PubMed
    1. Chao T.-C. & Hansmeier N. The current state of microbial proteomics: where we are and where we want to go. Proteomics 12, 638–650 (2012). - PubMed
    1. Cole J. N., Barnett T. C., Nizet V. & Walker M. J. Molecular insight into invasive group. A streptococcal disease. Nat. Rev. Microbiol. 9, 724–736 (2011). - PubMed

Publication types

MeSH terms