. 2013 Feb;27(2):280-95.
doi: 10.1210/me.2012-1260. Epub 2012 Dec 18.

Androgens promote prostate cancer cell growth through induction of autophagy

Affiliations

Androgens promote prostate cancer cell growth through induction of autophagy

Yan Shi et al. Mol Endocrinol. 2013 Feb.

Abstract

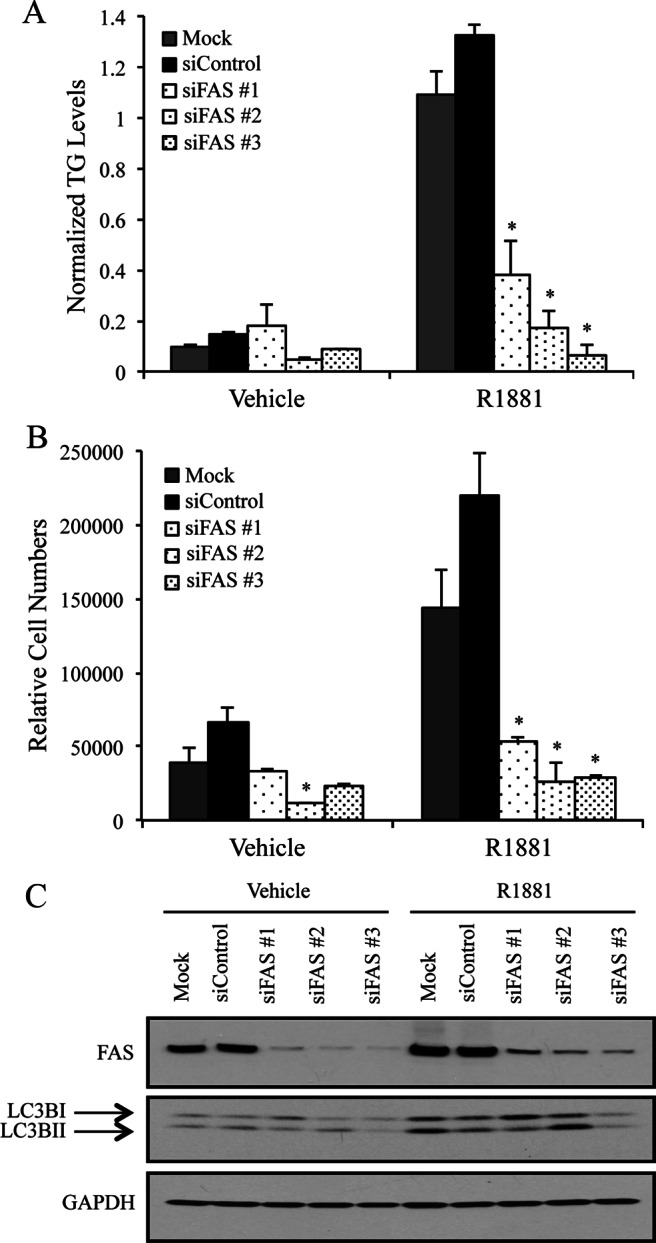
Androgens regulate both the physiological development of the prostate and the pathology of prostatic diseases. However, the mechanisms by which androgens exert their regulatory activities on these processes are poorly understood. In this study, we have determined that androgens regulate overall cell metabolism and cell growth, in part, by increasing autophagy in prostate cancer cells. Importantly, inhibition of autophagy using either pharmacological or molecular inhibitors significantly abrogated androgen-induced prostate cancer cell growth. Mechanistically, androgen-mediated autophagy appears to promote cell growth by augmenting intracellular lipid accumulation, an effect previously demonstrated to be necessary for prostate cancer cell growth. Further, autophagy and subsequent cell growth is potentiated, in part, by androgen-mediated increases in reactive oxygen species. These findings demonstrate a role for increased fat metabolism and autophagy in prostatic neoplasias and highlight the potential of targeting underexplored metabolic pathways for the development of novel therapeutics.


Figures

Fig. 1.
Fig. 1.
Autophagy is required for androgen-mediated prostate cell growth. A, LNCaP or VCaP cells were treated for 7 d with vehicle or the synthetic androgen R1881 in combination with vehicle or increasing concentrations of various inhibitors of autophagy (chloroquine: 1, 10, and 40 μm; 3-MA: 1 and 10 mm; bafilomycin A1: 1, 10, and 100 nm). Cells were then lysed, and the relative number of cells was quantified using a fluorescent DNA-binding dye. Each sample was performed in triplicate, and results from a representative experiment are shown. Results are expressed as mean relative cell number + se (n = 3). *, Significant changes from vehicle (no R1881)-treated cells; #, significant changes from vehicle (no autophagy inhibitor)-treated cells. B, LNCaP cells were transfected with mock, a control siRNA or siRNAs targeting three separate regions of the core autophagy molecule ATG7 and then treated for 7 d ± R1881. Relative cell numbers were then quantitated as in A. Each sample was performed in triplicate, and results from a representative experiment are shown. Results are expressed as mean relative cell number + se (n = 3). *, Significant changes from vehicle (no R1881)-treated cells; #, significant changes from mock-transfected cells. D, Western blot analysis of transfected LNCaP cell lysates to demonstrate ATG7 knockdown blocks autophagy as assessed by the decrease in the levels of LC3BII.
Fig. 2.
Fig. 2.
Androgens increase autophagy in an AR-dependent manner in prostate cancer cells. A, LNCaP cells were treated for 3 d with vehicle (ethanol) or 10 nm R1881. Cells were then fixed and examined by TEM. Left, AVs, autophagosomes and autolysosomes. Right, Quantification of the number of AVs in vehicle- and R1881-treated cells. Data are presented as the mean number of AVs/cell (n = 19 cells each). *, Significant changes from vehicle-treated cells. B, LNCaP or VCaP cells stably expressing an eGFP-LC3B fusion were treated for 3 d with vehicle, R1881 (10 nm), or the endogenous androgen DHT (10 nm). Redistribution of eGFP-LC3B (green) was covisualized with a DAPI nuclear stain (blue) using immunofluorescence confocal microscopy. Left, Representative pictures are shown. Scale bar, 20 μm. Right, Average number of punctae/cell (n = 30 cells) was analyzed and plotted. *, Significant changes from vehicle-treated cells. C, Indicated prostate cancer cells were treated for 3 d with vehicle or 10 nm R1881 and then subjected to Western blot analysis to determine LC3BI/II and GAPDH (loading control) levels. Below the images are the average LC3BII densitometry values normalized to GAPDH ± se (n ≥ 3). D, LNCaP cells were treated for 3 d with vehicle (−), 40 μm chloroquine (CQ) (blocks autophagic flux leading to build up of LC3BII), or increasing doses (0.1, 1, and 10 nm) of R1881 or DHT. Cells were then subjected to Western blot and densitometry analysis as in C. E, LNCaP cells were treated for 3 d ± 10 μm Casodex and ±10 nm R1881. Cells were then subjected to Western blot and densitometry analysis as in C.
Fig. 3.
Fig. 3.
Androgens increase autophagic flux in prostate cancer cells. A, LNCaP (representative pictures shown on left) or VCaP (representative pictures shown in Supplemental Fig. 2A) cells stably expressing an eGFP-LC3B fusion were treated for 3 d with vehicle or 10 nm R1881. Cells were then fixed and stained with LysoTracker to identify acidic organelles. eGFP-LC3B and LysoTracker colocalization was determined using immunofluorescence confocal microscopy. Scale bars, 10 μm. Quantification of colocalization (right) was done using ImageJ software. B, LNCaPs (representative pictures shown in Supplemental Fig. 2B) or VCaPs (representative pictures shown on left) were transfected with an mCherry-GFP-LC3B construct and treated for 3 d with vehicle, DHT (10 nm), or R1881 (10 nm) to assess autophagic flux. Cells were then fixed and visualized using a confocal immunofluorescence microscope. Scale bars, 10 μm. Right, Quantification of average total, GFP+mCherry+ (yellow, early autophagy/autophagosome) and GFPmCherry+ (red, late autophagy/autolysosomes) punctae/cell ± se for both LNCaP and VCaP cells (n > 10 cells each condition). *, Significant changes (P < 0.05) from vehicle-treated cells. **, Significant changes (P < 0.01) from vehicle-treated cells. C, LNCaP cells were treated for 3 d ± 10 μg/ml each of E-64-d and pepstatin A (specific lysosomal protease inhibitors) and ± 10 nm R1881. Cells were then subjected to Western blot analysis as in Fig. 2.
Fig. 4.
Fig. 4.
Autophagy promotes androgen-mediated lipid accumulation. A, LNCaP cells were treated for 3 d with vehicle (ethanol) or 10 nm R1881. Cells were then fixed and examined by TEM as in Fig. 2. B, LNCaP cells stably expressing an eGFP-LC3B fusion were treated for 3 d with vehicle, DHT (10 nm), or R1881 (10 nm). Cells were then fixed and costained with LipidTOX (neutral lipid depots) and DAPI (nucleus). eGFP-LC3B, LipidHTX, and DAPI colocalization was visualized using immunofluorescence confocal microscopy. Scale bars, 20 μm; 5 μm for higher resolution images on far right. C, LNCaP or VCaP cells were treated as in A and subjected to immunogold TEM to determine LC3B subcellular localization (yellow arrows). D, LNCaP cells were transfected with siRNAs as in Fig. 1B and treated for 3 d with vehicle or 10 nm R1881. Intracellular TG levels were then determined using a fluorescent Nile Red-based stain (AdipoRed) and normalized to cell numbers that were determined using duplicate plates that were instead subjected to the fluorescent DNA-binding dye described in Fig. 1. Each sample was performed in triplicate, and results from a representative experiment are shown. Results are expressed as TG levels normalized to cell numbers + se (n = 4). *, Significant changes from mock-transfected cells. E, LNCaP cells were treated with vehicle or increasing concentrations of chloroquine (CQ) ± 10 nm R1881 for 3 d. Intracellular TG levels were then determined as described in D. Each sample was performed in triplicate and results from a representative experiment are shown. Results are expressed as TG levels normalized to cell numbers + se (n = 4). *, Significant changes from vehicle (no CQ)-treated cells.
Fig. 5.
Fig. 5.
Inducible expression of ATG7-targeting shRNA inhibits androgen-mediated lipid accumulation and cell growth. A, Diagram of the pINDUCER11 construct used in this study. B and C, To characterize the LNCaP ATG7 shRNA stable cells, cells were treated for 2 d ± 800 ng/ml Dox and subjected to fluorescence microscopy (B) or Western blot analysis (C). D, TG levels were quantitated as described in Fig. 4 but using LNCaP ATG7 shRNA-inducible stable cells cotreated for 3 d ± Dox and ± R1881. Results are expressed as TG levels normalized to cell numbers + se (n = 2). *, Significant changes from double vehicle-treated cells. E, Stable cells were again cotreated but for 7 d followed by quantification of cell numbers using the assay described in Fig. 1. Results are expressed as mean relative cell number + se (n = 2). **, Significant change (P < 0.01) from R1881 alone-treated cells.
Fig. 6.
Fig. 6.
Autophagy-mediated lipid accumulation is downstream of FAS. LNCaP cells were transfected with mock, a negative scramble control (siControl) or three siRNAs targeting separate regions of FAS mRNA. Cells were then treated for 3 d with vehicle or 10 nm R1881. A, Cells were assayed for intracellular TG levels as described in Fig. 4D. Each sample was performed in triplicate, and results from a representative experiment are shown. Results are expressed as TG levels normalized to cell numbers + se (n = 2). *, Significant changes from mock-transfected cells. B, Cells were transfected with mock, a control siRNA, or siRNAs targeting three separate regions of FAS and then treated for 7 d ± R1881. Relative cell numbers were then quantitated as described in Fig. 1. Each sample was performed in triplicate, and results from a representative experiment are shown. Results are expressed as mean relative cell number + se (n = 3). *, Significant changes from mock-transfected cells. C, Lysates from LNCaP cells transfected and treated the same as in A were subjected to Western blot analysis. A representative blot is shown (n = 4).
Fig. 7.
Fig. 7.
Androgens promote autophagy-mediated cell growth, in part, through elevating intracellular ROS levels. A, VCaP cells were cotreated for 3 d ± 1 mm TEMPOL and ± 10 nm R1881. Cells were then assayed for ROS production using CM-H2DCF-DA-based fluorescence microscopy analysis. B, VCaP cells were treated as in A and subjected to Western blot analysis for LC3B and GAPDH (loading control). C, VCaP cells were treated as in A and B. Cells were then assayed for intracellular TG levels as described in Fig. 4D. Each sample was performed in triplicate, and results from a representative experiment are shown. Results are expressed as TG levels normalized to cell numbers + se (n = 2). *, Significant changes from double vehicle-treated cells. D, VCaP cells were again cotreated but for 7 d and then assayed for relative cell numbers as described in Fig. 1. Each sample was performed in triplicate, and results from a representative experiment are shown. Results are expressed as mean relative cell number + se (n = 3). *, Significant changes from double vehicle-treated cells.
Fig. 8.
Fig. 8.
Proposed model of how androgen-mediated autophagy promotes prostate cell growth. Androgens, via AR, promote intracellular lipid accumulation through 1) increasing the expression of enzymes involved in de novo lipogenesis (e.g. FAS, ACC, and ACL) and 2) elevating intracellular ROS levels. The increased ROS levels stimulate lipid accumulation through an autophagy-mediated mechanism that is not fully understood but is downstream/independent of FAS. The intracellular fat depots can then ultimately promote prostate cell growth and/or survival through potentially altering multiple aspects of cell biology and metabolism.

References

    1. Gao W, Dalton JT. 2007. Expanding the therapeutic use of androgens via selective androgen receptor modulators (SARMs). Drug Discov Today 12:241–248 - PMC - PubMed
    1. Culig Z, Bartsch G. 2006. Androgen axis in prostate cancer. J Cell Biochem 99:373–381 - PubMed
    1. Levine B, Kroemer G. 2008. Autophagy in the pathogenesis of disease. Cell 132:27–42 - PMC - PubMed
    1. Jiang M, Fernandez S, Jerome WG, He Y, Yu X, Cai H, Boone B, Yi Y, Magnuson MA, Roy-Burman P, Matusik RJ, Shappell SB, Hayward SW. 2010. Disruption of PPARγ signaling results in mouse prostatic intraepithelial neoplasia involving active autophagy. Cell Death Differ 17:469–481 - PMC - PubMed
    1. Mizushima N, Levine B. 2010. Autophagy in mammalian development and differentiation. Nat Cell Biol 12:823–830 - PMC - PubMed

Publication types