. 2013 Feb 1;288(5):3381-93.
doi: 10.1074/jbc.M112.414714. Epub 2012 Dec 17.

The non-lysosomal β-glucosidase GBA2 is a non-integral membrane-associated protein at the endoplasmic reticulum (ER) and Golgi

Affiliations

The non-lysosomal β-glucosidase GBA2 is a non-integral membrane-associated protein at the endoplasmic reticulum (ER) and Golgi

Heinz G Körschen et al. J Biol Chem. .

Abstract

GBA1 and GBA2 are both β-glucosidases, which cleave glucosylceramide (GlcCer) to glucose and ceramide. GlcCer is a main precursor for higher order glycosphingolipids but might also serve as intracellular messenger. Mutations in the lysosomal GBA1 underlie Gaucher disease, the most common lysosomal storage disease in humans. Knocking out the non-lysosomal GBA2 in mice results in accumulation of GlcCer outside the lysosomes in various tissues (e.g. testis and liver) and impairs sperm development and liver regeneration. However, the underlying mechanisms are not well understood. To reveal the physiological function of GBA2 and, thereby, of the non-lysosomal GlcCer pool, it is important to characterize the localization of GBA2 and its activity in different tissues. Thus, we generated GBA2-specific antibodies and developed an assay that discriminates between GBA1 and GBA2 without the use of detergent. We show that GBA2 is not, as previously thought, an integral membrane protein but rather a cytosolic protein that tightly associates with cellular membranes. The interaction with the membrane, in particular with phospholipids, is important for its activity. GBA2 is localized at the ER and Golgi, which puts GBA2 in a key position for a lysosome-independent route of GlcCer-dependent signaling. Furthermore, our results suggest that GBA2 might affect the phenotype of Gaucher disease, because GBA2 activity is reduced in Gba1 knock-out fibroblasts and fibroblasts from a Gaucher patient. Our results provide the basis to understand the mechanism for GBA2 function in vivo and might help to unravel the role of GBA2 during pathogenesis of Gaucher disease.


Figures

FIGURE 1.
FIGURE 1.
GBA2 is a non-integral membrane-associated protein. A, topology of mouse GBA2. Amino acid positions, the putative transmembrane domain (TM), and epitopes for the GBA2-specific antibodies (4A12, 2H1, 2F8, and 5A8; gray boxes, 1–4) are indicated. B, to validate GBA2-specific antibodies, Western blots of total lysates from HEK293 wild-type cells (ctrl), from HEK293 cells overexpressing GBA2-HA (HA), and from wild-type (WT) and Gba2 knock-out (KO) testis were performed using different anti-GBA2 antibodies. Calnexin was used as a loading control. C, HEK293 cells overexpressing GBA2-HA were labeled with the 4A12 (red) and HA antibody (green), followed by the corresponding fluorescently labeled secondary antibody. DAPI (blue) has been used to label DNA. Scale bar, 25 μm. D, non-permeabilized and Triton X-100-permeabilized HEK293 cells overexpressing GBA2 were labeled with the 4A12 antibody (red), followed by the corresponding fluorescently labeled secondary antibody. GFP (green) was used as a control. Scale bar, 25 μm. E, HEK293 cells were transfected with YFP-PrP (positive control; fusion between the GPI-anchored PrP and YFP; yellow) or eGFP-GBA2 (green). Cells were treated with trypsin for 1 min and imaged before (control) and after trypsin incubation (trypsin). Arrows highlight fluorescence of YFP-Prp at the plasma membrane. Scale bar, 25 μm. F, hypotonic lysates from liver, brain, testis, and HEK293 cells overexpressing GBA2-HA or HA-GBA2 were centrifuged at low speed. The supernatant (PNS) was subjected to high speed centrifugation, and the resulting pellet was subjected to multiple hypotonic (hypo) and carbonate washes (car). The corresponding pellet fractions (P) and supernatants (S) have been subjected to Western blotting and labeled with anti-GBA2 antibodies (mixture of 4A12/2F8). Calnexin was used as a loading control.
FIGURE 2.
FIGURE 2.
GBA2 is localized at the ER and Golgi in HEK293 cells. A, to analyze the subcellular localization, HEK293 cells overexpressing GBA2 were labeled with the following antibodies: 4A12 (GBA2; red), calnexin (ER; green), GM-130 (cis-Golgi; green), and giantin (Golgi cisternae; green) followed by the corresponding fluorescently labeled secondary antibody. DAPI (blue) was used to label DNA. Scale bar, 5 μm. B, to depolymerize microtubules, HEK293 cells overexpressing GBA2 were treated with 2.5 μg/ml nocodazole for 2.5 h. After wash-out of nocodazole, microtubules repolymerized again. Antibodies were those described in A and β-tubulin-CY3 (cyan). Scale bar, 10 μm. C, to reveal the topology of GBA2, HEK293 cells have been transfected with GBA2-eGFP or eGFP-GBA2 (green). YFP-CD3δ (YFP facing the ER lumen; yellow) and CD3δ-CFP (CFP facing the cytosolic side; cyan) have been used as a control. Cells were imaged before (control), after treatment with 20 μm digitonin, and after treatment with 4 mm trypsin for 1 min each. Scale bar, 25 μm.
FIGURE 3.
FIGURE 3.
GBA2 is localized at the ER and Golgi in hippocampal neurons. A, to analyze the expression of GBA2 in mouse brain, Western blots of total lysates from different brain regions (MB, midbrain; OB, olfactory bulb; CB, cerebellum; HC, hippocampus; CO, cortex) were labeled with a GBA2 antibody. Calnexin was used as a loading control. B, to analyze the localization of GBA2 in the hippocampus, hippocampal neurons were isolated from mouse embryos at embryonic day 17 and co-cultured with astrocytes. Cells were labeled with a GBA2 antibody (4A12; red) and a GFAP-antibody (astrocyte marker; green) followed by the corresponding fluorescently labeled secondary antibody. DAPI (blue) was used to label DNA. Scale bar, 40 μm. C, to analyze the subcellular localization of GBA2 in hippocampal neurons, cells were labeled with the following antibodies: 4A12 (GBA2; red), calnexin (ER; green), GM-130 (cis-Golgi; green), and giantin (Golgi cisternae; green), followed by the corresponding fluorescently labeled secondary antibody. Scale bars are indicated. D, schematic representing the topology and intracellular localization of GBA2.
FIGURE 4.
FIGURE 4.
Fluorescence-based β-glucosidase activity assay distinguishes between GBA1 and GBA2 activity in HEK293 cells and native tissue. A, pH dependence of β-glucosidase activity in the presence of detergent in liver from wild-type mice. Activity was measured in lysates containing 0.25% Triton X-100, 0.25% sodium taurocholate, and 4 mm β-mercaptoethanol using a 1.67 mm concentration of the artificial substrate 4-MU-β-d-glucopyranoside in the absence (no blocker) or presence of 30 μm CBE, 10 μm NB-DNJ, or both. B, as in A for HEK293 cells overexpressing GBA2. C, pH dependence of β-glucosidase activity in the absence of detergent in liver of wild-type (WT) mice. Activity was measured in hypotonic lysates using a 1.67 mm concentration of the artificial substrate 4-MU-β-d-glucopyranoside in the absence (no blocker) or presence of 30 μm CBE, 10 μm NB-DNJ, or both. D, as in C for HEK293 cells overexpressing GBA2. All data are presented as mean ± S.D. (error bars) (n = 3). E, dose-response relationship for CBE at pH 4 and 6 in the absence of detergent in liver, brain, and testis of wild-type mice. Maximal activity was set to 100%. IC50 values at pH 4 were as follows: liver, 3.5 ± 0.4 μm; brain, 2.5 ± 0.3 μm; testis, 2.7 ± 0.3 μm. F, as in E for NB-DNJ. IC50 values at pH 6 were as follows: liver, 20.9 ± 1.3 nm; brain, 18.2 ± 0.3 nm; testis, 19.2 ± 0.4 nm. G, dose-response relationship for CBE at pH 4.0, 5.5, and 6.0 in liver from wild-type mice in the presence or absence of detergent. Maximal activity has been set to 100%. IC50 values (without detergent) were as follows: pH 4.0, 3.6 ± 0.2 μm; pH 5.5 and pH 6.0, not determined. IC50 values (with detergent) were as follows: pH 4.0, 5.1 ± 0.3 μm; pH 5.5, 6.9 ± 0.3 μm; pH 6.0, 11.7 ± 0.7 μm. H, as in G for NB-DNJ. IC50 values (without detergent) were as follows: pH 4.0, not determined; pH 5.5, 17.4 ± 1.5 nm; pH 6.0, 12.0 ± 0.7 nm. IC50 values (with detergent) were as follows: pH 4.0, not determined; pH 5.5, 9.7 ± 0.3 μm; pH 6.0, 11.0 ± 0.7 μm.
FIGURE 5.
FIGURE 5.
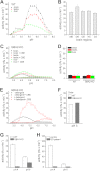
GBA1 and GBA2 display differential activities in different tissues. A, pH dependence of β-glucosidase activity in wild-type (WT) brain, testis, and liver. Activity was measured in hypotonic lysates in the absence of detergent using a 1.67 mm concentration of the artificial substrate 4-MU-β-d-glucopyranoside. B, β-glucosidase activity in different brain regions from wild-type mice (MB, midbrain; OB, olfactory bulb; CB, cerebellum; HC, hippocampus; CO, cortex). Activity was measured in hypotonic lysates in the absence of detergent. C, pH dependence of β-glucosidase activity in tissues from Gba2 knock-out mice (GBA2-KO). Activity was measured as in A in the absence or presence of 30 μm CBE. D, β-glucosidase activity at pH 4 in brain, testis, and liver from wild-type (WT) and Gba2 knock-out (KO) mice (n = 3). E, as in C for liver in the absence or presence of detergent. F, β-glucosidase activity at pH 5 in the presence of detergent in lysates from wild-type and Gba2 knock-out liver (GBA2-KO). G, β-glucosidase activity at pH 4 and 6 in embryonic fibroblasts from wild-type and Gba1 knock-out mice (GBA1-KO). H, β-glucosidase activity at pH 4 and 6 in human fibroblasts from a control and a Gaucher disease patient (GD). All data are presented as mean ± S.D. (error bars) Shown are representative data from one animal or one patient if not otherwise stated.
FIGURE 6.
FIGURE 6.
GBA2 activity is dependent on membrane association and requires the presence of lipids. A, β-glucosidase activity at pH 6 was measured using a 1.67 mm concentration of the artificial substrate 4-MU-β-d-glucopyranoside. Hypotonic lysates (total) from wild-type testis were centrifuged at low speed (PNS), and the pellet was subjected to multiple hypotonic washing and centrifugation steps (1–3). The resulting membrane (P) and soluble fractions (S) were numbered accordingly. B, as in A for liver. C, as in A for brain. Shown is a representative experiment for tissues from one wild-type mouse. D, β-glucosidase activity at pH 6 was measured as follows: in membrane fractions (membrane) from brain of Gba2 knock-out mice (brain KO) and bovine rod outer segments (bROS), in protein-free (PC) liposomes, in the supernatant from brain of wild-type mice and HEK293 cells overexpressing GBA2, and in a combination of the fractions (supernatant + membrane). All data are presented as mean ± S.D. (error bars).

References

    1. Lahiri S., Futerman A. H. (2007) The metabolism and function of sphingolipids and glycosphingolipids. Cell. Mol. Life Sci. 64, 2270–2284 - PMC - PubMed
    1. Hirabayashi Y. (2012) A world of sphingolipids and glycolipids in the brain. Novel functions of simple lipids modified with glucose. Proc. Jpn. Acad. Ser. B Phys. Biol. Sci. 88, 129–143 - PMC - PubMed
    1. Futerman A. H., Pagano R. E. (1991) Determination of the intracellular sites and topology of glucosylceramide synthesis in rat liver. Biochem. J. 280, 295–302 - PMC - PubMed
    1. Jeckel D., Karrenbauer A., Burger K. N., van Meer G., Wieland F. (1992) Glucosylceramide is synthesized at the cytosolic surface of various Golgi subfractions. J. Cell Biol. 117, 259–267 - PMC - PubMed
    1. Paul P., Kamisaka Y., Marks D. L., Pagano R. E. (1996) Purification and characterization of UDP-glucose:ceramide glucosyltransferase from rat liver Golgi membranes. J. Biol. Chem. 271, 2287–2293 - PubMed

Publication types

MeSH terms