Global remodeling of the vascular stem cell niche in bone marrow of diabetic patients: implication of the microRNA-155/FOXO3a signaling pathway
- PMID: 23250986
- PMCID: PMC3616365
- DOI: 10.1161/CIRCRESAHA.112.300598
Global remodeling of the vascular stem cell niche in bone marrow of diabetic patients: implication of the microRNA-155/FOXO3a signaling pathway
Abstract
Rationale: The impact of diabetes mellitus on bone marrow (BM) structure is incompletely understood.
Objective: Investigate the effect of type-2 diabetes mellitus (T2DM) on BM microvascular and hematopoietic cell composition in patients without vascular complications.
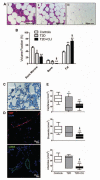
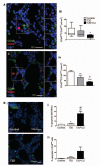
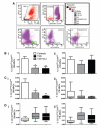
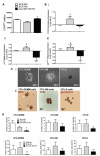
Methods and results: Bone samples were obtained from T2DM patients and nondiabetic controls (C) during hip replacement surgery and from T2DM patients undergoing amputation for critical limb ischemia. BM composition was assessed by histomorphometry, immunostaining, and flow cytometry. Expressional studies were performed on CD34(pos) immunosorted BM progenitor cells (PCs). Diabetes mellitus causes a reduction of hematopoietic tissue, fat deposition, and microvascular rarefaction, especially when associated with critical limb ischemia. Immunohistochemistry documented increased apoptosis and reduced abundance of CD34(pos)-PCs in diabetic groups. Likewise, flow cytometry showed scarcity of BM PCs in T2DM and T2DM+critical limb ischemia compared with C, but similar levels of mature hematopoietic cells. Activation of apoptosis in CD34(pos)-PCs was associated with upregulation and nuclear localization of the proapoptotic factor FOXO3a and induction of FOXO3a targets, p21 and p27(kip1). Moreover, microRNA-155, which regulates cell survival through inhibition of FOXO3a, was downregulated in diabetic CD34(pos)-PCs and inversely correlated with FOXO3a levels. The effect of diabetes mellitus on anatomic and molecular end points was confirmed when considering background covariates. Furthermore, exposure of healthy CD34(pos)-PCs to high glucose reproduced the transcriptional changes induced by diabetes mellitus, with this effect being reversed by forced expression of microRNA-155.
Conclusions: We provide new anatomic and molecular evidence for the damaging effect of diabetes mellitus on human BM, comprising microvascular rarefaction and shortage of PCs attributable to activation of proapoptotic pathway.
Figures


Similar articles
-
MicroRNA-21/PDCD4 Proapoptotic Signaling From Circulating CD34+ Cells to Vascular Endothelial Cells: A Potential Contributor to Adverse Cardiovascular Outcomes in Patients With Critical Limb Ischemia.Diabetes Care. 2020 Jul;43(7):1520-1529. doi: 10.2337/dc19-2227. Epub 2020 May 1. Diabetes Care. 2020. PMID: 32358022 Free PMC article.
-
Reversible secretome and signaling defects in diabetic mesenchymal stem cells from peripheral arterial disease patients.J Vasc Surg. 2018 Dec;68(6S):137S-151S.e2. doi: 10.1016/j.jvs.2018.05.223. Epub 2018 Aug 10. J Vasc Surg. 2018. PMID: 30104096 Free PMC article.
-
Time course and mechanisms of circulating progenitor cell reduction in the natural history of type 2 diabetes.Diabetes Care. 2010 May;33(5):1097-102. doi: 10.2337/dc09-1999. Epub 2010 Feb 11. Diabetes Care. 2010. PMID: 20150295 Free PMC article.
-
Concise review: diabetes, the bone marrow niche, and impaired vascular regeneration.Stem Cells Transl Med. 2014 Aug;3(8):949-57. doi: 10.5966/sctm.2014-0052. Epub 2014 Jun 18. Stem Cells Transl Med. 2014. PMID: 24944206 Free PMC article. Review.
-
Adipose tissue as a potential source of hematopoietic stem/progenitor cells.Obesity (Silver Spring). 2012 May;20(5):923-31. doi: 10.1038/oby.2011.398. Epub 2012 Jan 26. Obesity (Silver Spring). 2012. PMID: 22282043 Review.
Cited by
-
Bone marrow vasculature advanced in vitro models for cancer and cardiovascular research.Front Cardiovasc Med. 2023 Oct 17;10:1261849. doi: 10.3389/fcvm.2023.1261849. eCollection 2023. Front Cardiovasc Med. 2023. PMID: 37915743 Free PMC article. Review.
-
Bone marrow pericyte dysfunction in individuals with type 2 diabetes.Diabetologia. 2019 Jul;62(7):1275-1290. doi: 10.1007/s00125-019-4865-6. Epub 2019 Apr 17. Diabetologia. 2019. PMID: 31001672 Free PMC article.
-
Prolonged DEHP exposure enhances the stemness and metastatic potential of TNBC cells in an MSI2-dependent manner.Int J Biol Sci. 2025 Feb 3;21(4):1705-1729. doi: 10.7150/ijbs.101598. eCollection 2025. Int J Biol Sci. 2025. PMID: 39990676 Free PMC article.
-
Cell Therapy for Critical Limb Ischemia: Advantages, Limitations, and New Perspectives for Treatment of Patients with Critical Diabetic Vasculopathy.Curr Diab Rep. 2021 Mar 2;21(3):11. doi: 10.1007/s11892-021-01378-4. Curr Diab Rep. 2021. PMID: 33651185 Free PMC article. Review.
-
MicroRNA‑93 regulates angiogenesis in peripheral arterial disease by targeting CDKN1A.Mol Med Rep. 2019 Jun;19(6):5195-5202. doi: 10.3892/mmr.2019.10196. Epub 2019 Apr 25. Mol Med Rep. 2019. PMID: 31059098 Free PMC article.
References
-
- Tepper OM, Galiano RD, Capla JM, Kalka C, Gagne PJ, Jacobowitz GR, Levine JP, Gurtner GC. Human endothelial progenitor cells from type II diabetics exhibit impaired proliferation, adhesion, and incorporation into vascular structures. Circulation. 2002;106:2781–2786. - PubMed
-
- Loomans CJ, de Koning EJ, Staal FJ, Rookmaaker MB, Verseyden C, de Boer HC, Verhaar MC, Braam B, Rabelink TJ, van Zonneveld AJ. Endothelial progenitor cell dysfunction: a novel concept in the pathogenesis of vascular complications of type 1 diabetes. Diabetes. 2004;53:195–199. - PubMed
-
- Fadini GP, Miorin M, Facco M, Bonamico S, Baesso I, Grego F, Menegolo M, de Kreutzenberg SV, Tiengo A, Agostini C, Avogaro A. Circulating endothelial progenitor cells are reduced in peripheral vascular complications of type 2 diabetes mellitus. J Am Coll Cardiol. 2005;45:1449–1457. - PubMed
Publication types
MeSH terms
Substances
Grants and funding
LinkOut - more resources
Full Text Sources
Other Literature Sources
Medical
Research Materials
Miscellaneous

