. 2013 Jan 2;110(1):129-34.
doi: 10.1073/pnas.1204291110. Epub 2012 Dec 18.

Migration of cells in a social context

Affiliations

Migration of cells in a social context

Søren Vedel et al. Proc Natl Acad Sci U S A. .

Abstract

In multicellular organisms and complex ecosystems, cells migrate in a social context. Whereas this is essential for the basic processes of life, the influence of neighboring cells on the individual remains poorly understood. Previous work on isolated cells has observed a stereotypical migratory behavior characterized by short-time directional persistence with long-time random movement. We discovered a much richer dynamic in the social context, with significant variations in directionality, displacement, and speed, which are all modulated by local cell density. We developed a mathematical model based on the experimentally identified "cellular traffic rules" and basic physics that revealed that these emergent behaviors are caused by the interplay of single-cell properties and intercellular interactions, the latter being dominated by a pseudopod formation bias mediated by secreted chemicals and pseudopod collapse following collisions. The model demonstrates how aspects of complex biology can be explained by simple rules of physics and constitutes a rapid test bed for future studies of collective migration of individual cells.


Conflict of interest statement

The authors declare no conflict of interest.

Figures

Fig. 1.
Fig. 1.
Trajectories of the cells generated during the first 200 min of an experiment. (A) Trajectories (yellow) displayed on top of the fluorescence image illustrating the different fusion proteins used for the cytosols (red) and nuclei (green). (B) Trajectories can be nominally straight, curve, or display little apparent directionality. The vectorial sum of the pseudopodia of the cell (marked by red in insets) predicts the observed movement, because each pseudopod applies nominally the same force (20).
Fig. 2.
Fig. 2.
Experimental observations of cell migration and pseudopodia. (A) Single-cell speed distribution, with inset showing speed vs. time for four single cells. (B) Average single-cell speed distribution (blue; error bars indicate SD) is well fitted by a generalized extreme value (GEV) distribution characterized by the location parameter m, the scale parameter s, and the shape parameter ξ. (C) Population distribution of single-cell maximum path distance (MPD). (D) Chamber-average directional autocorrelation (blue circles) and fit (orange line). Also shown are single-cell autocorrelations from two sample cells moving nominally straight (lines). The SD of the distribution decays from ±0.20 min close to τlag = 0 to ± = 0.01 at τlag = 200 min (SI Appendix, Fig. S5). (EH) Effect of density on collective cellular migration; dashed lines in FH indicate results for isolated cells extracted from ref. (compare with SI Appendix, Fig. S4). (E) Examples of trajectories (compare with SI Appendix, Fig. S2) and (F) the corresponding average directional autocorrelations that follow the same exponential decay (Inset). (G) Weight ϕ and persistence time τp from least squares fits of average directional autocorrelations to formula image as a function of the average minimum nucleus-nucleus distance formula image in the chamber showing that persistence time τp is not affected by the changing density whereas the weight factor ϕ decreases due to higher collision rate. (H) Location m, scale s, and shape ξ from least squares fits of average single-cell speed distributions to the GEV distribution remains constant across densities. (I) Time periods of contact for colliding cell pairs (combined for all densities) is heavily dominated by short times, and the distribution is independent of cell density (SI Appendix, Fig. S8A). Also shown are the actual trajectories of two colliding cells (blue and green), with red arrows indicating direction of motion. (J) Pseudopod formation angle Δα with the current direction of motion (pooled across densities) shows a clear a clear preference of pseudopod formation in the current direction of motion, although pseudopodia are observed to form at all angles. This distribution is independent of cell density (SI Appendix, Fig. S8C). (K) Position and angle of pseudopod formation Δθ in relation to the nearest neighbor cell. At time t = 0, the entire volume of the microfluidic chamber is replaced with fresh media, effectively removing any chemokine background and allowing new chemokine gradients to be established (see schematic to the right). The cells overwhelmingly move to the nearest neighbor during the first 20 min after media replacement but only mildly so (and only when the nearest neighbor is very close) after 60 min, indicating that secreted chemokines induce pseudopod formation (SI Appendix).
Fig. 3.
Fig. 3.
Model formulation and predictions (model, red; experiments, blue). Experimental data are the same as in Fig. 2. (A) Single cells move by dynamically and stochastically forming pseudopodia (red) while they secrete chemokine, with each pseudopod providing a force, and colliding pseudopodia collapse. (B) Example model trajectories. (C) Average displacement in a 300-min simulation for different relative gradients (the gradient is applied only in the y direction) illustrate that model cells reliably respond to gradients above 0.002 μm⋅m−1, as experimentally observed by Melvin et al. (16). The simulation was repeated 20 times for a single cell at each gradient level and error bars indicate SD. (D) Single-cell speed distributions (compare with Fig. 2A). (E) Average single-cell speed distribution, showing excellent agreement with experiments. (F) Chamber-averaged directional autocorrelation and one single-cell autocorrelation from a cell moving nominally straight (compare with Fig. 2D; compare with SI Appendix, Fig. S5. (G) Population distribution of maximum path distance (blue, experiment; red, model). (H and I) Model results across densities with the latter expressed by the average minimum cell-cell distance formula image 
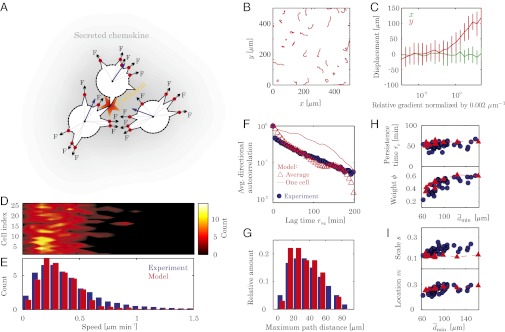
(red, model; blue, experiment). (H) Weight ϕ and persistence time τp for the fit to formula image. (I) Location parameter m and scale parameter s in fit of average speed distribution to a GEV distribution. The shape parameter ξ (SI Appendix, Fig. S11), describing the tail of the distribution, is not well captured by the model because it underpredicts this part of the speed distribution, as seen in E.

References

    1. Orlic D, et al. Bone marrow cells regenerate infarcted myocardium. Nature. 2001;410(6829):701–705. - PubMed
    1. Abercrombie M, Heaysman JEM. Observations on the social behaviour of cells in tissue culture. I. Speed of movement of chick heart fibroblasts in relation to their mutual contacts. Exp Cell Res. 1953;5(1):111–131. - PubMed
    1. Abercrombie M, Heaysman JE. Observations on the social behaviour of cells in tissue culture. II. Monolayering of fibroblasts. Exp Cell Res. 1954;6(2):293–306. - PubMed
    1. Yates CA, et al. Inherent noise can facilitate coherence in collective swarm motion. Proc Natl Acad Sci USA. 2009;106(14):5464–5469. - PMC - PubMed
    1. Ballerini M, et al. Interaction ruling animal collective behavior depends on topological rather than metric distance: Evidence from a field study. Proc Natl Acad Sci USA. 2008;105(4):1232–1237. - PMC - PubMed

Publication types