. 2012:2012:329214.
doi: 10.1155/2012/329214. Epub 2012 Nov 6.

(Radio)biological optimization of external-beam radiotherapy

Affiliations

(Radio)biological optimization of external-beam radiotherapy

Alan E Nahum et al. Comput Math Methods Med. 2012.

Abstract

"Biological optimization" (BIOP) means planning treatments using (radio)biological criteria and models, that is, tumour control probability and normal-tissue complication probability. Four different levels of BIOP are identified: Level I is "isotoxic" individualization of prescription dose D(presc) at fixed fraction number. D(presc) is varied to keep the NTCP of the organ at risk constant. Significant improvements in local control are expected for non-small-cell lung tumours. Level II involves the determination of an individualized isotoxic combination of D(presc) and fractionation scheme. This approach is appropriate for "parallel" OARs (lung, parotids). Examples are given using our BioSuite software. Hypofractionated SABR for early-stage NSCLC is effectively Level-II BIOP. Level-III BIOP uses radiobiological functions as part of the inverse planning of IMRT, for example, maximizing TCP whilst not exceeding a given NTCP. This results in non-uniform target doses. The NTCP model parameters (reflecting tissue "architecture") drive the optimizer to emphasize different regions of the DVH, for example, penalising high doses for quasi-serial OARs such as rectum. Level-IV BIOP adds functional imaging information, for example, hypoxia or clonogen location, to Level III; examples are given of our prostate "dose painting" protocol, BioProp. The limitations of and uncertainties inherent in the radiobiological models are emphasized.


Figures

Figure 1
Figure 1
Illustration of the potential of TCP/NTCP-based optimization; the two arrows on the “Tumour Dose” axis indicate two different “isotoxic” prescription doses, D pr, associated with the full and dashed NTCP curves which correspond to “large volume” and “small volume” dose coverage of the OAR. The improvement in TCP, from 45% to 90%, that would result from such a change in dose to the tumour, is also shown.
Figure 2
Figure 2
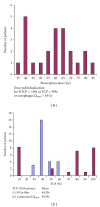
The distribution of NTCP values (grade 2 pneumonitis) estimated for a series of Clatterbridge NSCLC patients all with a D presc of 55 Gy in 20 fractions; LKB model used with parameters α/β = 3; TD 50 = 24.5 Gy; m = 0.37, n = 1 [35]. The extremely wide variation in NTCP is simply a reflection of the wide variation in tumour sizes, tumour position, and hence volume of lung in the radiation fields. Note that the average NTCP was 9.5% [36] (adapted from [38]).
Figure 3
Figure 3
(a) The spectrum of D presc resulting from “isotoxic” NTCP = 10% (grade 2 radiation pneumonitis) or TCP = 99% or D max⁡(oesophagus) = 63 Gy (whichever is the lowest) for the 24 patients of Figure 2. (b) TCP values for the constant 55 Gy prescription dose (blue) and the individualized D presc shown in Figure 3(a). The increase in the mean TCP over the patient sample is obtained for no change in mean NTCP (adapted from Malik et al. (2007) with the TCP values recalculated using the parameters in [37]).
Figure 4
Figure 4
The variation of NTCP for radiation pneumonitis and oesophagitis, respectively, as a function of the number of fractions for a NSC lung radiotherapy case planned using tomotherapy (IMRT) and 3-D conformal techniques. The total dose is adjusted for tumour isoeffect using α/β = 10. The increase in oesophageal NTCP is consistent with the conventional application of the Withers formula [41], but the near constancy of lung NTCP is definitely not. Note also that the NTCP values are consistently lower for the more conformal tomotherapy plan (from [42]).
Figure 5
Figure 5
The variation of TCP with number of fractions, where the total dose (the numbers in the little squares) is adjusted to keep maintain isotoxicity, in this case 10% NTCP for the endpoint of grade 2 radiation pneumonitis (for parameters see Figure 2). The plot was generated by the BioSuite software [53]. In this case the standard prescription of 55 Gy in 20 fractions yielded TCP = 48%, NTCP = 6.6% (BioSuite is available from julien.uzan@clatterbridgecc.nhs.uk).
Figure 6
Figure 6
The variation of TCP with number of fractions, where the total dose (the numbers in the little squares) is adjusted to keep maintaining isotoxicity, in this case 10% NTCP for the endpoint of grade 2 radiation pneumonitis (for LKB parameters see Figure 2). The plot was generated by the BioSuite software [53]. In this case the standard prescription of 55 Gy in 20 fractions yielded TCP = 50.4%, NTCP = 4.3% (BioSuite is available from julien.uzan@clatterbridgecc.nhs.uk).
Figure 7
Figure 7
Dose-volume histograms for a radiobiologically guided inverse plan (3-field IMRT) aiming to maximize TCP for the same NTCP (labelled as “Bio-Plan (isotoxic)”) compare to a standard (3-field) treatment plan delivering 55 Gy (in 20 daily fractions) to a NSC lung tumour. The target volume (PTV, GTV) doses are more heterogeneous in the radiobiological plan. The increases in TCP values for the standard and radiobiologically optimized plans are also shown; the TCP parameters are from Nahum et al. [37]—see the subsection on “Level I” BIOP.
Figure 8
Figure 8
An example of a treatment under the Clatterbridge BIOPROP radiobiologically optimized prostate dose-painting protocol. The DIL is shown in pink on the left. The DVHs for the standard and dose painting plans are shown on the right. The TCP values are computed assuming that all the clonogens are contained in the DIL (or that any clonogens outside are 100% controlled). The NTCP values shown in the table correspond to rectal bleeding.

References

    1. Loverock L. Linear accelerators, ch. 36. In: Mayles P, Nahum A, Rosenwald JC, editors. Handbook of Radiotherapy Physics. Theory and Practice. London, UK: Taylor & Francis; 2007. pp. 197–239.
    1. Neal A. Patient data acquisition, ch. 30. In: Mayles P, Nahum A, Rosenwald JC, editors. Handbook of Radiotherapy Physics. Theory and Practice. London, UK: Taylor & Francis; 2007. pp. 647–655.
    1. Bidmead M, Rosenwald JC. Dose evaluation of treatment plans, ch. 35. In: Mayles P, Nahum A, Rosenwald JC, editors. Handbook of Radiotherapy Physics. Theory and Practice. London, UK: Taylor & Francis; 2007. pp. 719–729.
    1. Mayle P, Williams P. Megavoltage photon beams, ch. 22. In: Mayles P, Nahum A, Rosenwald JC, editors. Handbook of Radiotherapy Physics. Theory and Practice. London, UK: Taylor & Francis; 2007. pp. 451–481.
    1. Tait DM, Nahum AE, Meyer LC, et al. Acute toxicity in pelvic radiotherapy; a randomised trial of conformal versus conventional treatment. Radiotherapy and Oncology. 1997;42(2):121–136. - PubMed