Research blogging: indexing and registering the change in science 2.0
- PMID: 23251358
- PMCID: PMC3520957
- DOI: 10.1371/journal.pone.0050109
Research blogging: indexing and registering the change in science 2.0
Erratum in
-
Correction: research blogging: indexing and registering the change in science 2.0.PLoS One. 2015 Apr 7;10(4):e0124184. doi: 10.1371/journal.pone.0124184. eCollection 2015. PLoS One. 2015. PMID: 25849025 Free PMC article. No abstract available.
Abstract
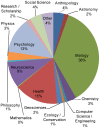
Increasing public interest in science information in a digital and 2.0 science era promotes a dramatically, rapid and deep change in science itself. The emergence and expansion of new technologies and internet-based tools is leading to new means to improve scientific methodology and communication, assessment, promotion and certification. It allows methods of acquisition, manipulation and storage, generating vast quantities of data that can further facilitate the research process. It also improves access to scientific results through information sharing and discussion. Content previously restricted only to specialists is now available to a wider audience. This context requires new management systems to make scientific knowledge more accessible and useable, including new measures to evaluate the reach of scientific information. The new science and research quality measures are strongly related to the new online technologies and services based in social media. Tools such as blogs, social bookmarks and online reference managers, Twitter and others offer alternative, transparent and more comprehensive information about the active interest, usage and reach of scientific publications. Another of these new filters is the Research Blogging platform, which was created in 2007 and now has over 1,230 active blogs, with over 26,960 entries posted about peer-reviewed research on subjects ranging from Anthropology to Zoology. This study takes a closer look at RB, in order to get insights into its contribution to the rapidly changing landscape of scientific communication.
Conflict of interest statement
Figures


References
-
- MacRoberts M, MacRoberts B (2010) Problems of citation analysis: A study of uncited and seldom–cited influences. Journal of the American Society for Information Science and Technology 61 (1) 1–12 doi:10.1002/asi.21228 - DOI
-
- Anderson K (2009) The impact factor: A tool from a bygone era? The Scholarly Kitchen (29 June). Available: http://scholarlykitchen.sspnet.org/2009/06/29/is-the-impact-factor-from-.... Accessed 15 January 2012.
-
- Rosner M, Van Epps H, Hill E (2007) Show me the data. Journal of Experimental Medicine 204 (13) 1091–1092 doi:10.1083/jcb.200711140 - DOI - PMC - PubMed
-
- Arbesman S (2012) New Ways to Measure Science. Social Dimension Wired Science Blogs (9 Jan). Available: http://www.wired.com/wiredscience/2012/01/new-ways-to-measure-science/all/1. Accessed 10 January 2012.
-
- Wikipedia. Philosophical Transactions of the Royal Society. Available: http://en.wikipedia.org/wiki/Philosophical_Transactions_of_the_Royal_Soc.... Accessed 10 January 2012.
MeSH terms
LinkOut - more resources
Full Text Sources

