

Meta-analysis of gene expression signatures defining the epithelial to mesenchymal transition during cancer progression
- PMID: 23251436
- PMCID: PMC3519484
- DOI: 10.1371/journal.pone.0051136
Meta-analysis of gene expression signatures defining the epithelial to mesenchymal transition during cancer progression
Abstract
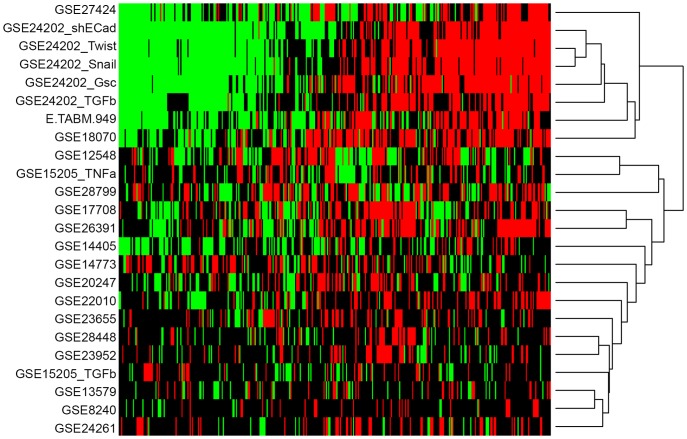
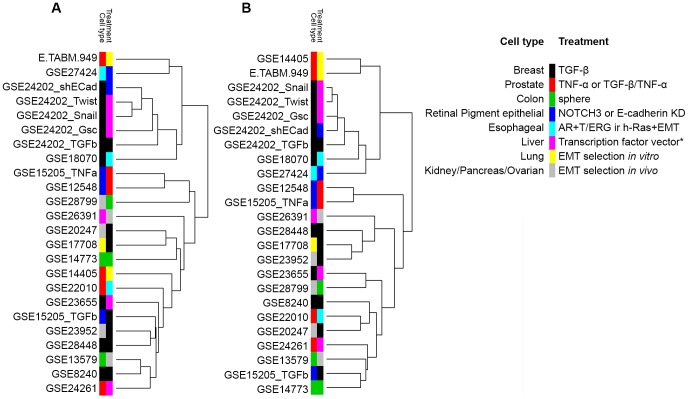
The epithelial to mesenchymal transition (EMT) represents a crucial event during cancer progression and dissemination. EMT is the conversion of carcinoma cells from an epithelial to a mesenchymal phenotype that associates with a higher cell motility as well as enhanced chemoresistance and cancer stemness. Notably, EMT has been increasingly recognized as an early event of metastasis. Numerous gene expression studies (GES) have been conducted to obtain transcriptome signatures and marker genes to understand the regulatory mechanisms underlying EMT. Yet, no meta-analysis considering the multitude of GES of EMT has been performed to comprehensively elaborate the core genes in this process. Here we report the meta-analysis of 18 independent and published GES of EMT which focused on different cell types and treatment modalities. Computational analysis revealed clustering of GES according to the type of treatment rather than to cell type. GES of EMT induced via transforming growth factor-β and tumor necrosis factor-α treatment yielded uniformly defined clusters while GES of models with alternative EMT induction clustered in a more complex fashion. In addition, we identified those up- and downregulated genes which were shared between the multitude of GES. This core gene list includes well known EMT markers as well as novel genes so far not described in this process. Furthermore, several genes of the EMT-core gene list significantly correlated with impaired pathological complete response in breast cancer patients. In conclusion, this meta-analysis provides a comprehensive survey of available EMT expression signatures and shows fundamental insights into the mechanisms that are governing carcinoma progression.
Conflict of interest statement
Figures

References
-
- Hay ED (1995) An overview of epithelio-mesenchymal transformation. Acta Anat (Basel) 154: 8–20. - PubMed
-
- Hay ED (2005) The mesenchymal cell, its role in the embryo, and the remarkable signaling mechanisms that create it. Dev Dyn 233: 706–720. - PubMed
-
- Friedl P, Alexander S (2011) Cancer invasion and the microenvironment: plasticity and reciprocity. Cell 147: 992–1009. - PubMed
Publication types
MeSH terms
LinkOut - more resources
Full Text Sources
Other Literature Sources
