

High spatial resolution and temporally resolved T2* mapping of normal human myocardium at 7.0 Tesla: an ultrahigh field magnetic resonance feasibility study
- PMID: 23251708
- PMCID: PMC3522647
- DOI: 10.1371/journal.pone.0052324
High spatial resolution and temporally resolved T2* mapping of normal human myocardium at 7.0 Tesla: an ultrahigh field magnetic resonance feasibility study
Abstract
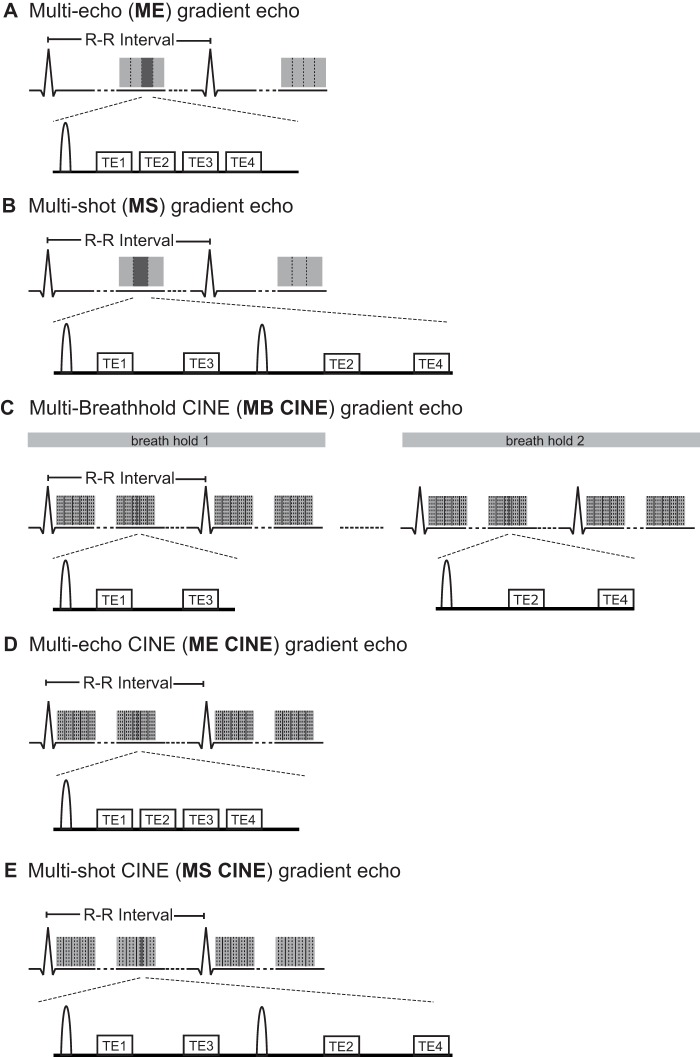
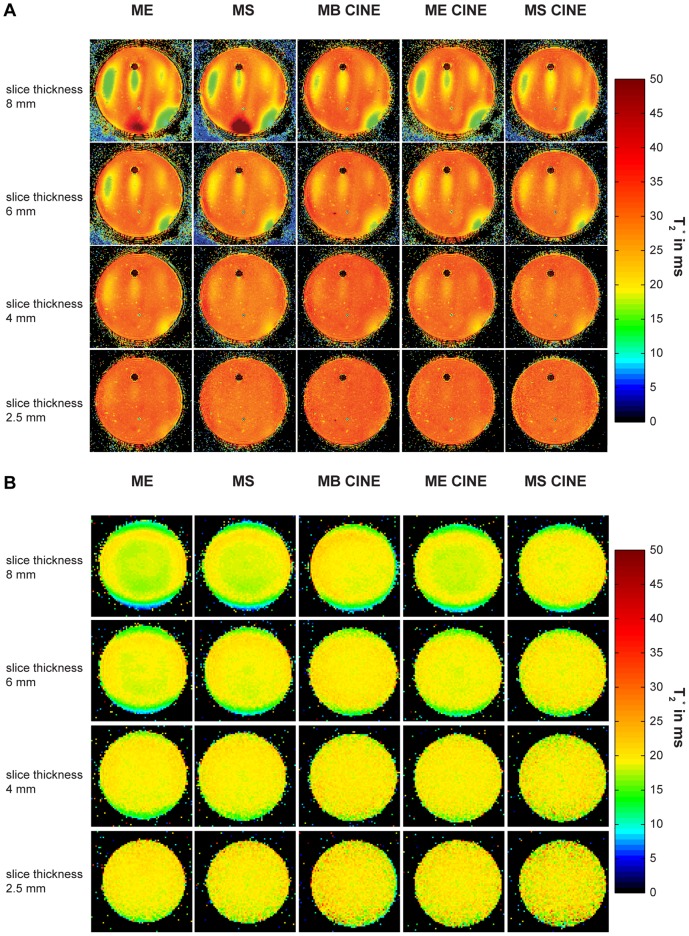
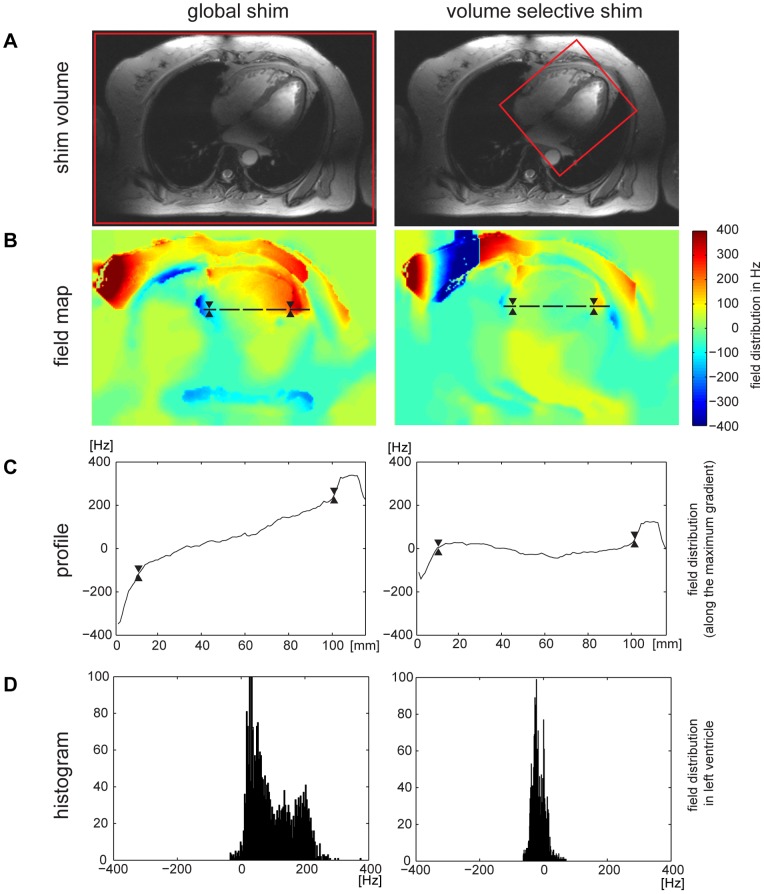
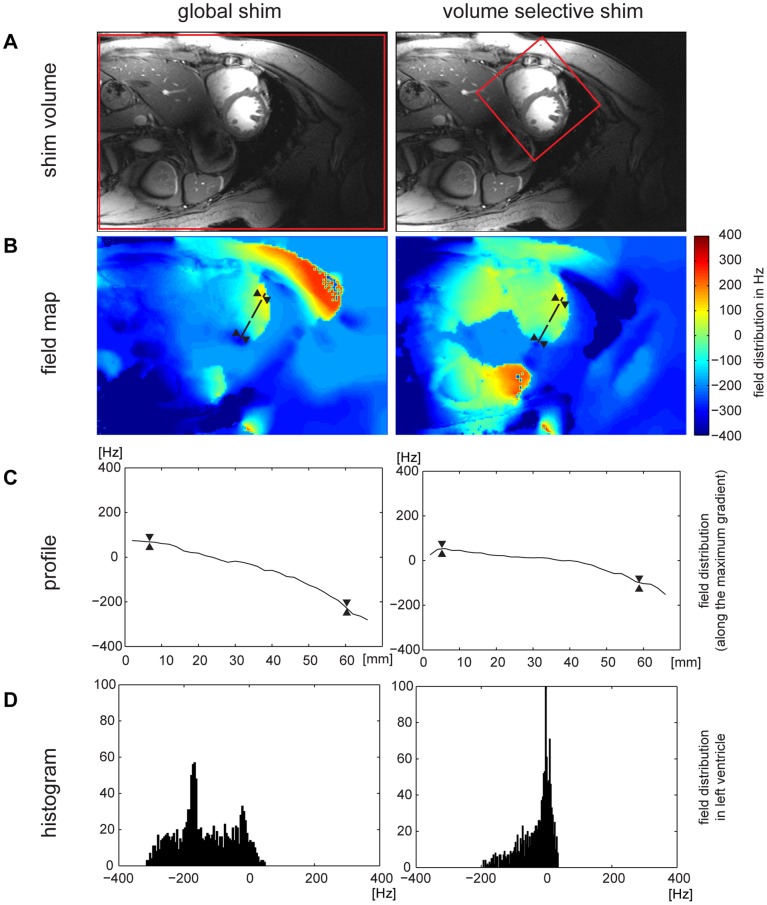
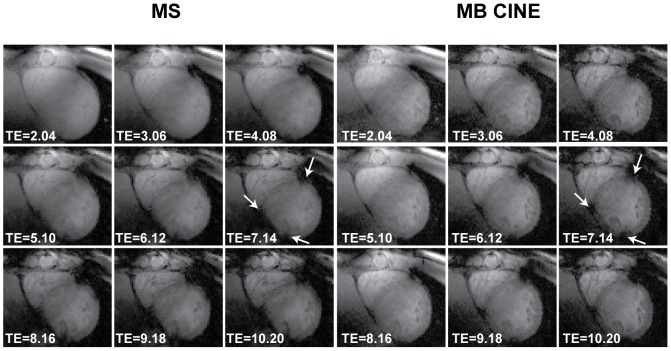
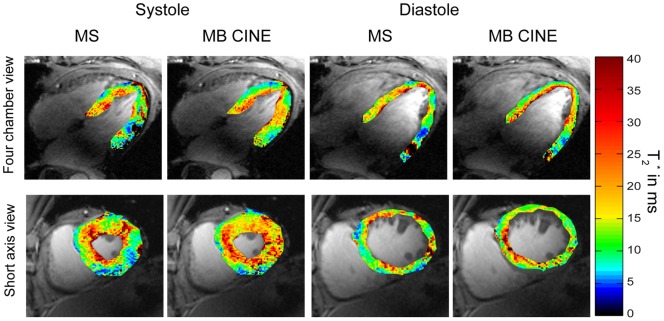
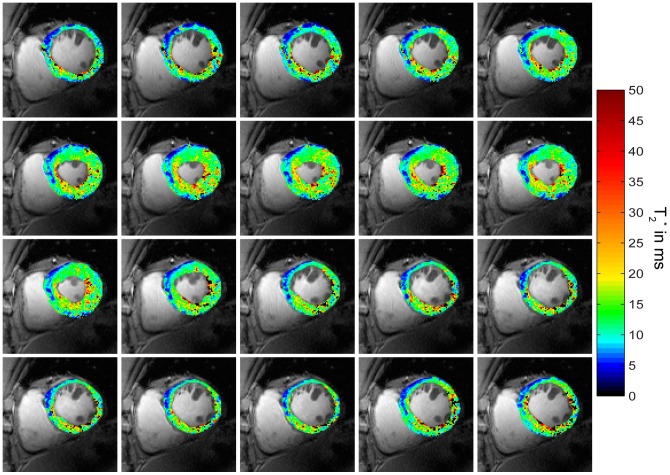
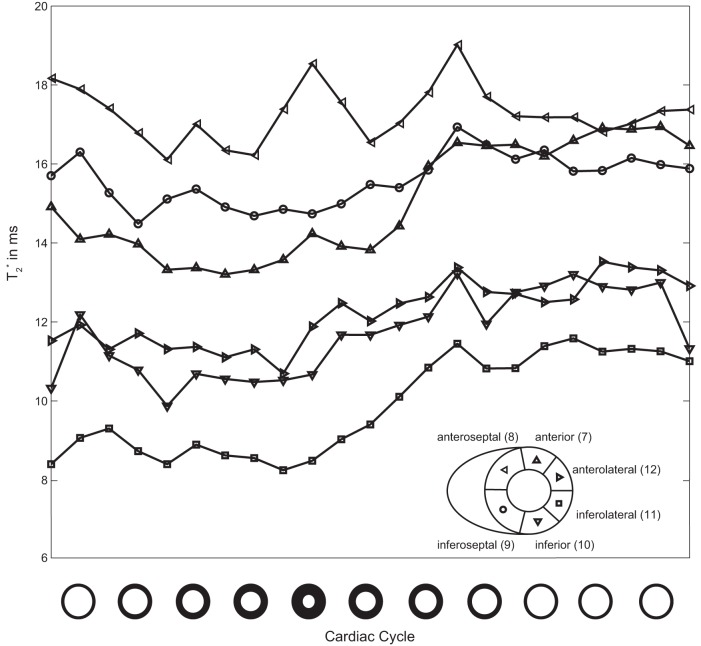
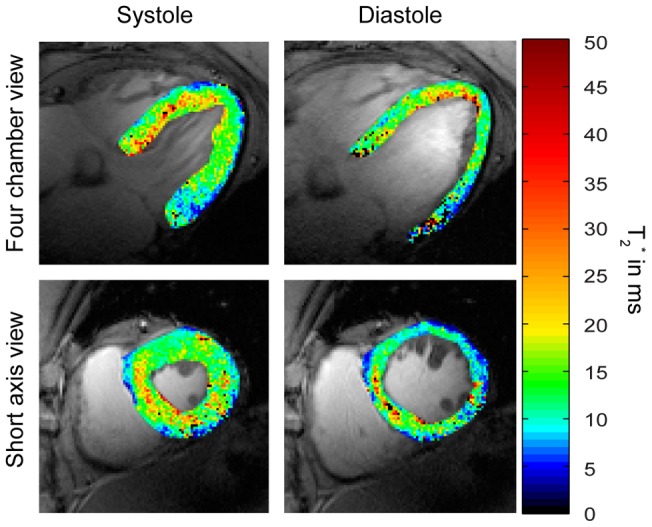
Myocardial tissue characterization using T(2)(*) relaxation mapping techniques is an emerging application of (pre)clinical cardiovascular magnetic resonance imaging. The increase in microscopic susceptibility at higher magnetic field strengths renders myocardial T(2)(*) mapping at ultrahigh magnetic fields conceptually appealing. This work demonstrates the feasibility of myocardial T(2)(*) imaging at 7.0 T and examines the applicability of temporally-resolved and high spatial resolution myocardial T(2)(*) mapping. In phantom experiments single cardiac phase and dynamic (CINE) gradient echo imaging techniques provided similar T(2)(*) maps. In vivo studies showed that the peak-to-peak B(0) difference following volume selective shimming was reduced to approximately 80 Hz for the four chamber view and mid-ventricular short axis view of the heart and to 65 Hz for the left ventricle. No severe susceptibility artifacts were detected in the septum and in the lateral wall for T(2)(*) weighting ranging from TE = 2.04 ms to TE = 10.2 ms. For TE >7 ms, a susceptibility weighting induced signal void was observed within the anterior and inferior myocardial segments. The longest T(2)(*) values were found for anterior (T(2)(*) = 14.0 ms), anteroseptal (T(2)(*) = 17.2 ms) and inferoseptal (T(2)(*) = 16.5 ms) myocardial segments. Shorter T(2)(*) values were observed for inferior (T(2)(*) = 10.6 ms) and inferolateral (T(2)(*) = 11.4 ms) segments. A significant difference (p = 0.002) in T(2)(*) values was observed between end-diastole and end-systole with T(2)(*) changes of up to approximately 27% over the cardiac cycle which were pronounced in the septum. To conclude, these results underscore the challenges of myocardial T(2)(*) mapping at 7.0 T but demonstrate that these issues can be offset by using tailored shimming techniques and dedicated acquisition schemes.
Conflict of interest statement
Figures
Similar articles
-
Myocardial Effective Transverse Relaxation Time T 2* is Elevated in Hypertrophic Cardiomyopathy: A 7.0 T Magnetic Resonance Imaging Study.Sci Rep. 2018 Mar 5;8(1):3974. doi: 10.1038/s41598-018-22439-x. Sci Rep. 2018. PMID: 29507338 Free PMC article.
-
Myocardial effective transverse relaxation time T2* Correlates with left ventricular wall thickness: A 7.0 T MRI study.Magn Reson Med. 2017 Jun;77(6):2381-2389. doi: 10.1002/mrm.26312. Epub 2016 Jun 25. Magn Reson Med. 2017. PMID: 27342430
-
Detailing magnetic field strength dependence and segmental artifact distribution of myocardial effective transverse relaxation rate at 1.5, 3.0, and 7.0 T.Magn Reson Med. 2014 Jun;71(6):2224-30. doi: 10.1002/mrm.24856. Epub 2013 Jun 28. Magn Reson Med. 2014. PMID: 23813553
-
Variability and homogeneity of cardiovascular magnetic resonance myocardial T2-mapping in volunteers compared to patients with edema.J Cardiovasc Magn Reson. 2013 Mar 27;15(1):27. doi: 10.1186/1532-429X-15-27. J Cardiovasc Magn Reson. 2013. PMID: 23537111 Free PMC article.
-
Feasibility of cardiac gating free of interference with electro-magnetic fields at 1.5 Tesla, 3.0 Tesla and 7.0 Tesla using an MR-stethoscope.Invest Radiol. 2009 Sep;44(9):539-47. doi: 10.1097/RLI.0b013e3181b4c15e. Invest Radiol. 2009. PMID: 19652614
Cited by
-
[Cardiovascular ultrahigh field magnetic resonance imaging : challenges, technical solutions and opportunities].Radiologe. 2013 May;53(5):422-8. doi: 10.1007/s00117-012-2348-6. Radiologe. 2013. PMID: 23613023 German.
-
Experimental MRI Monitoring of Renal Blood Volume Fraction Variations En Route to Renal Magnetic Resonance Oximetry.Tomography. 2017 Dec;3(4):188-200. doi: 10.18383/j.tom.2017.00012. Tomography. 2017. PMID: 30042981 Free PMC article.
-
Myocardial Effective Transverse Relaxation Time T 2* is Elevated in Hypertrophic Cardiomyopathy: A 7.0 T Magnetic Resonance Imaging Study.Sci Rep. 2018 Mar 5;8(1):3974. doi: 10.1038/s41598-018-22439-x. Sci Rep. 2018. PMID: 29507338 Free PMC article.
-
Emerging methods for the characterization of ischemic heart disease: ultrafast Doppler angiography, micro-CT, photon-counting CT, novel MRI and PET techniques, and artificial intelligence.Eur Radiol Exp. 2021 Mar 25;5(1):12. doi: 10.1186/s41747-021-00207-3. Eur Radiol Exp. 2021. PMID: 33763754 Free PMC article. Review.
-
Regionally resolved cardiac metabolism using a dipole-loop array coil for 7 T 31P-MRSI.Magn Reson Med. 2025 Aug;94(2):480-496. doi: 10.1002/mrm.30492. Epub 2025 Mar 23. Magn Reson Med. 2025. PMID: 40123193 Free PMC article.
References
-
- Positano V, Pepe A, Santarelli MF, Scattini B, De Marchi D, et al. (2007) Standardized T2* map of normal human heart in vivo to correct T2* segmental artefacts. NMR Biomed 20: 578–590. - PubMed
-
- He T, Gatehouse PD, Kirk P, Mohiaddin RH, Pennell DJ, et al. (2008) Myocardial T(*)2 measurement in iron-overloaded thalassemia: An ex vivo study to investigate optimal methods of quantification. Magn Reson Med 60: 350–356. - PubMed
-
- Heinrichs U, Utting JF, Frauenrath T, Hezel F, Krombach GA, et al. (2009) Myocardial T2* mapping free of distortion using susceptibility-weighted fast spin-echo imaging: a feasibility study at 1.5 T and 3.0 T. Magn Reson Med. 62: 822–828. - PubMed
-
- Hernando D, Vigen KK, Shimakawa A, Reeder SB (2011) R 2* mapping in the presence of macroscopic B(0) field variations. Magn Reson Med.
-
- Bauer WR, Nadler W, Bock M, Schad LR, Wacker C, et al. (1999) The relationship between the BOLD-induced T(2) and T(2)(*): a theoretical approach for the vasculature of myocardium. Magn Reson Med 42: 1004–1010. - PubMed
Publication types
MeSH terms
LinkOut - more resources
Full Text Sources
Medical
