. 2012 Dec 19;4(165):165ra162.
doi: 10.1126/scitranslmed.3004108.

Genetic correction of human induced pluripotent stem cells from patients with spinal muscular atrophy

Affiliations

Genetic correction of human induced pluripotent stem cells from patients with spinal muscular atrophy

Stefania Corti et al. Sci Transl Med. .

Abstract

Spinal muscular atrophy (SMA) is among the most common genetic neurological diseases that cause infant mortality. Induced pluripotent stem cells (iPSCs) generated from skin fibroblasts from SMA patients and genetically corrected have been proposed to be useful for autologous cell therapy. We generated iPSCs from SMA patients (SMA-iPSCs) using nonviral, nonintegrating episomal vectors and used a targeted gene correction approach based on single-stranded oligonucleotides to convert the survival motor neuron 2 (SMN2) gene into an SMN1-like gene. Corrected iPSC lines contained no exogenous sequences. Motor neurons formed by differentiation of uncorrected SMA-iPSCs reproduced disease-specific features. These features were ameliorated in motor neurons derived from genetically corrected SMA-iPSCs. The different gene splicing profile in SMA-iPSC motor neurons was rescued after genetic correction. The transplantation of corrected motor neurons derived from SMA-iPSCs into an SMA mouse model extended the life span of the animals and improved the disease phenotype. These results suggest that generating genetically corrected SMA-iPSCs and differentiating them into motor neurons may provide a source of motor neurons for therapeutic transplantation for SMA.


Figures
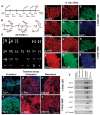
Fig. 1
Fig. 1
Reprogramming human fibroblasts of an SMA patient and his father without genomic vector integration, and selection of iPSC clones. (A) Schematic representation of the nonviral reprogramming protocol for adult human fibroblasts. (B) Episomal vector maps. (C to N) Immunocytochemical characterization of iPSC clones derived from an SMA patient (SMA-iPSCs) and his heterozygous father (HET-iPSCs). These iPSCs express pluripotency transcription factors including NANOG (red), SOX2 (red), and OCT4 (green) (C to E and I to K), as well as stem cell surface markers (SSEA-4, red) and TRA-1-60 (green). Blue, 4′,6-diamidino-2-phenylindole (DAPI) nuclear stain. (F) to (H) and (L) to (N) are representative images. (O) These cells (HET-iPSCs) were karyotypically normal. (P to U) SMA-iPSC clones and HET-iPSCs form teratomas in vivo that contain the three germ layers as shown by representative images from one SMA-iPSC and one HET-iPSC clone: ectoderm (TuJ1, green), mesoderm (desmin, red), and endoderm (α-fetoprotein, red). (V) PCR analysis of episomal DNA in iPSC clones. Genomic (G) and episomal (E) DNAs from nontransfected and vector-transfected adult human fibroblasts were used as negative (–) and positive (+) controls, respectively. No plasmid integration into iPSCs was observed. Scale bars, 100 μm (C to N); 150 μm (L to N) and (P to U).
Fig. 2
Fig. 2
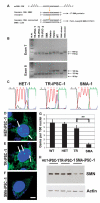
Genetic correction by modification of the SMN2 gene using oligonucleotides in SMA-iPSCs. (A) Targeted SMN2sequence and correcting oligonucleotides. The blue base in the oligonucleotides is the base that directs the targeting to the red base in the SMN2 sequence, which will render exon 7 in SMN2 like exon 7 in SMN1, resulting in its inclusion during splicing. (B and C) Restriction digest and cycle sequencing confirm base conversion in SMN2 in SMA-iPSCs. (B) The PCR products were subjected to restriction enzyme treatment: Dra1 for exon 7 (upper panel) and Dde1 for exon 8 (lower panel) (the enzymes Dra I and Dde I cleave the PCR products from SMN2 exons 7 and 8, respectively). In the corrected SMA-iPSCs, the presence of an uncut band corresponds to corrected exon 7, and the complete digested band (cut) corresponds to exon 8. This pattern corresponds to the modification of theSMN2 gene into the SMN1-like gene and rules out the possibility of a contamination with wild-type (WT) or heterozygous DNA. PCR electrophoresis showed the predicted band sizes: 175 bp for SMN1 and 190 bp forSMN2 for exon 7 (upper panel). The three SMA-iPSC clones showed the presence of both bands, supporting the exon 7 base conversion to that of SMN1. (C) The results of the sequencing reaction confirm the conversion. The asterisk on a double peak indicates that both T and C have been detected, implying that this sample is heterozygous for SMN1 and SMN2. (D to G) The number of gems detected by SMN immunocytochemistry was higher in the HET-iPSCs (HET), WT iPSCs, and oligonucleotide-treated SMA-iPSCs (TR) when compared to untreated SMA-iPSCs (SMA) (**P ≤ 0.01). Mean ± SD, n = 5 independent experiments per condition [one-way analysis of variance (ANOVA) followed by a Tukey’s post hoc test]. (H) Western blot analysis showed that corrected SMA-iPSCs had higher SMN protein concentrations than untreated SMA-iPSCs.
Fig. 3
Fig. 3
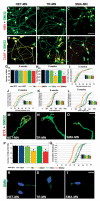
Differentiation of iPSCs from SMA patients into motor neurons. (A to F) After differentiation of iPSCs (HET-iPSCs, corrected and untreated SMA-iPSCs, TR, and SMA, respectively), the following motor neuron markers were expressed: SMI32- (green) and HB9-positive (red) (A to C) or ChAT (red) (yellow represents the merging of red and green colors). (D to F) Double-positive motor neurons were observed (merged, yellow). Nuclei are labeled with DAPI (blue). (G to L) Morphometric analysis of motor neurons. (G and H) Quantification of motor neurons at 5 (G) and 8 weeks (H) after differentiation from iPSCs, showing a reduced number of untreated SMA-iPSC–derived motor neurons compared to corrected SMA-iPSC–derived motor neurons (one-way ANOVA followed by a Tukey’s post hoc test) (*P < 0.001, 8 weeks). Values represent means ± SEM from five independent experiments performed in triplicate. (I to L) At 8 weeks, untreated SMA-iPSC motor neurons showed smaller cell diameters (J) and shorter axon lengths (L) than did motor neurons from the other three groups TR, WT, and HET (all, P < 0.001; size: SMA versus TR, P = 0.002). The difference was more evident at 8 weeks than at 5 weeks (I to K). Insets represent the respective medians. Five independent experiments performed in triplicate. (M to O) Neuromuscular junctions formed when motor neurons were cocultured with myotubes. The acetylcholine receptors were labeled with α-bungarotoxin (red) and axons with SMI32 (green). These are representative images. (P and Q) We evaluated the number (P) and size (Q) of neuromuscular junctions and found a reduced size and number of neuromuscular junctions in untreated SMA-iPSC motor neurons (SMA; patients 1 and 2) compared to corrected SMA-iPSC or HET-iPSC motor neurons (*P < 0.001, one-way ANOVA followed by a Tukey’s post hoc test). (P) Mean ± SEM, n = 5 independent experiments in triplicate. (Q) Inset represents the respective medians. (R to T) Gems are present in HET-MN (R) and TR-MN (S) but were absent in SMA-MN (T). Scale bars, 100 μm (A to C); 80 μm (D to F); 20 μm (M to O); 50 μm (R to T).
Fig. 4
Fig. 4
Global gene expression and splicing analysis of iPSC-derived motor neurons. (A) Volcano plot for the class comparisons of gene expression. In the upper region of the picture are the most deregulated genes (green, down-regulated; red, up-regulated). (B) Venn diagram comparing the common differentially expressed genes. (C) Result for the three classes from the splicing analysis. The most significant data are marked in red, orange, and yellow and listed in the Supplementary Materials. (D) Splicing analysis of some of the most significantly deregulated genes. Figures illustrate the genes found to be differentially spliced, indicating from top to bottom the expression intensities and FIRMA scores for the individual probes in the probe sets [untreated (red) and corrected (blue) SMA-iPSC motor neurons; green, HET-iPSC motor neurons]. The gene, different transcripts, and exons are illustrated, with the blue bars indicating the association of the probe sets with the individual exons. The most significant probe set based on the FIRMA score is highlighted. (E) Western blot analysis of the deregulated proteins in motor neurons from untreated iPSCs (SMA), corrected iPSCs (TR), and HET-iPSCs. There is down-regulation of SMN in motor neurons from untreated iPSCs (SMA) compared to those from corrected iPSCs (TR) and HET-iPSCs. The most commonSTMN2 isoform as well as PLP1 appear to be down-regulated in the motor neurons from untreated iPSCs (SMA) compared to those from corrected iPSCs (TR) and HET-iPSCs. In the same Western blot, there are also some other differentially expressed bands between the two samples.
Fig. 5
Fig. 5
Transplanted motor neurons ameliorate the disease phenotype of SMA mice. (A) Engraftment of human donor iPSC-derived motor neurons in spinal cord of SMA mice. Representative images of GFP-tagged transplanted motor neurons, located in the anterior horns of the spinal cord, coexpressed motor neuron– specific proteins like ChAT. GFP (green), ChAT (red), merged (yellow); nuclei were stained with DAPI (blue). Scale bars, 75 μm (first to second rows); 50 μm (third row). The engraftment analysis was performed at the disease end stage; n = 24 per group. (B) Quantification of engrafted motor neurons and donor axons in the anterior roots; n = 24 per group. (C) Representative image of neuromuscular junctions formed with paravertebral muscles by axons (green) of donor transplanted treated SMA-iPSC–derived motor neurons. Cholinergic receptors are labeled with bungarotoxin (BTX, red). Merge, yellow. Scale bar, 20 μm. (D) Human motor neuron transplantation ameliorated muscle atrophy in SMA mice. Histograms of myofiber diameters: Mean tibialis anterior muscle cross-sectional area was reduced in vehicle-treated SMA mice compared with WT littermates (P < 0.00001) and was augmented after transplantation of motor neurons from different sources (P < 0.00001). Data represent mean values ± SD. Mean total myofiber number was reduced in vehicle-treated SMA mice compared with WT littermates (P < 0.00001) and increased after transplantation of motor neurons from different sources (P< 0.00001). n = 6 per group at postnatal day 13 (P13). (E) Gross appearance of an SMA mouse transplanted with motor neurons derived from corrected SMA-iPSCs (MNTR), a vehicle-treated SMA mouse (SMA), and a WT mouse showing that the transplanted SMA mice were larger than vehicle-treated SMA mice (P13). Survival was extended for mice transplanted with motor neurons compared with vehicle-treated and fibroblast-transplanted SMA mice (P < 0.00001) as shown by Kaplan-Meier survival curves. Transplanted SMA mice survived for HET-MN (median, 21 days), SMA-MN (19 days), oligodeoxynucleotide-corrected SMA-MN (TR-MN, 21 days), or human primary fibroblasts (13 days) or vehicle-treated mice (SMA, 14 days). Transplanted SMA mice presented increased weight compared with vehicle-treated SMA mice (P13; P < 0.00001), as shown by weight curves. All plots are shown as means of weight with error bars representing SD. The grip time was statistically different between the transplanted and vehicle-treated SMA mice (P < 0.00001) at 13 days. Error bars represent SD. At P13, the number of crossings of transplanted mice was increased with respect to vehicle-treated mice in the open-field test (P < 0.00001, ANOVA followed by a Tukey’s post hoc test for multiple comparisons).
Fig. 6
Fig. 6
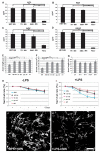
Human iPSC-derived motor neurons produce neuroprotective factors. (A to D) Amounts of (A) NT3, (B) NT4, (C) NGF, and (D) VEGF secreted in vitro by motor neurons and evaluated by ELISA. **P < 0.00001, two-tailed Student’s t test. Mean ± SD, n = 12 independent experiments for each cytokine. (E and F) Average length of axons (E) and growth cone area of motor neurons (F) from SMA mice, in coculture with human motor neurons. Motor neurons from SMA mice cocultured with human motor neurons exhibited an increase in axon length and size of growth cone with respect to SMA mouse motor neurons not cocultured with human motor neurons (**P < 0.00001, two-tailed Student’s t test; mean ± SD, n = 4 independent experiments for each condition). (G) The average axonal length of cocultured SMA mouse motor neurons was reduced after cytokine neutralization of cytokine production by human motor neurons (P < 0.05, two-tailed Student’s t test; mean ± SD, n = 4 independent experiments for each condition). (H and I) Quantification of the number of SMI32-positive SMA murine motor neurons in the presence of human motor neurons and microglial-conditioned media with (I) and without (H) lipopolysaccharide (LPS). The number of SMA mouse motor neurons in cultures with microglia + LPS was reduced but was increased in coculture with human motor neurons (mean ± SD, n = 4 independent experiments for each condition). (J and K) Representative SMI32 staining of SMA murine motor neurons (black and white were used to show the morphometric characteristics, that is, number and axonal length of cells) exposed to microglial-conditioned medium with LPS, with (J) or without (K) human motor neuron coculture. Scale bar, 50 μm.

Similar articles

Cited by

References

    1. Lefebvre S, Bürglen L, Reboullet S, Clermont O, Burlet P, Viollet L, Benichou B, Cruaud C, Millasseau P, Zeviani M, Le Paslier D, Frézal J, Cohen D, Weissenbach J, Munnich A, Melki J. Identification and characterization of a spinal muscular atrophy-determining gene. Cell. 1995;80:155–165. - PubMed
    1. Coovert DD, Le TT, McAndrew PE, Strasswimmer J, Crawford TO, Mendell JR, Coulson SE, Androphy EJ, Prior TW, Burghes AH. The survival motor neuron protein in spinal muscular atrophy. Hum. Mol. Genet. 1997;6:1205–1214. - PubMed
    1. Crawford TO, Pardo CA. The neurobiology of childhood spinal muscular atrophy. Neurobiol. Dis. 1996;3:97–110. - PubMed
    1. Munsat TL, Davies KE. International SMA consortium meeting. (26-28 June 1992, Bonn, Germany) Neuromuscul. Disord. 1992;2:423–428. - PubMed
    1. Lorson CL, Hahnen E, Androphy EJ, Wirth B. A single nucleotide in the SMN gene regulates splicing and is responsible for spinal muscular atrophy. Proc. Natl. Acad. Sci. U.S.A. 1999;96:6307–6311. - PMC - PubMed

Publication types

Substances