. 2012 Dec 19;4(165):165ra163.
doi: 10.1126/scitranslmed.3003454.

Long-term follow-up after gene therapy for canavan disease

Affiliations

Long-term follow-up after gene therapy for canavan disease

Paola Leone et al. Sci Transl Med. .

Abstract

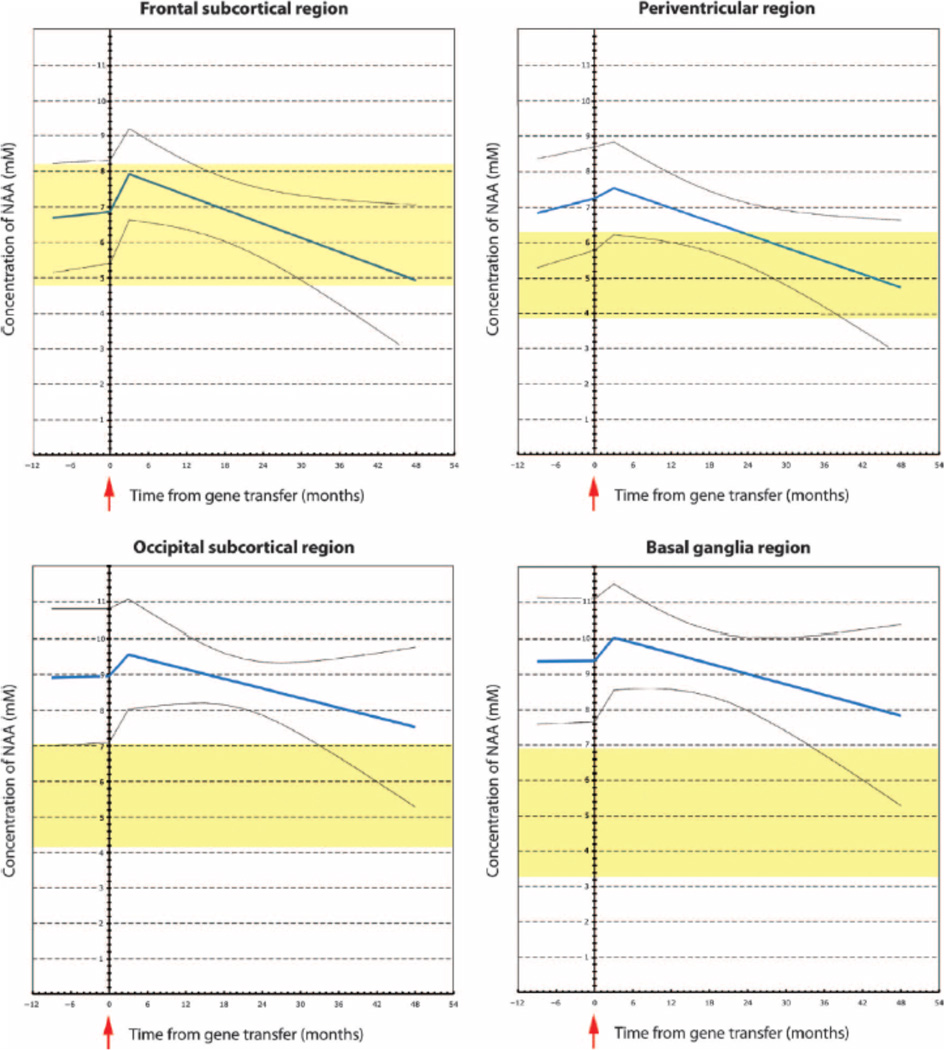
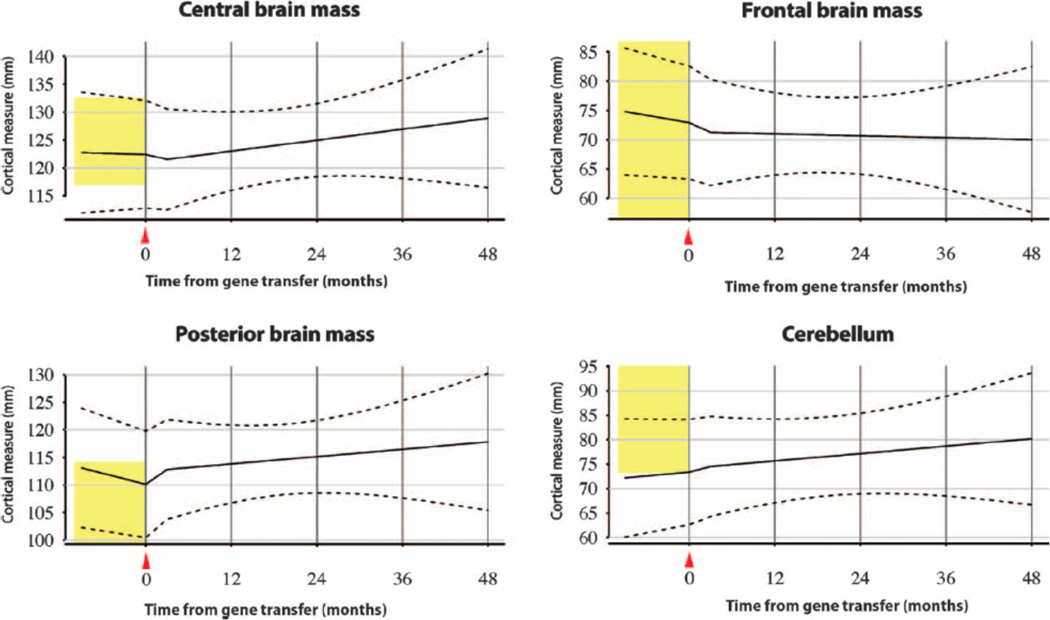
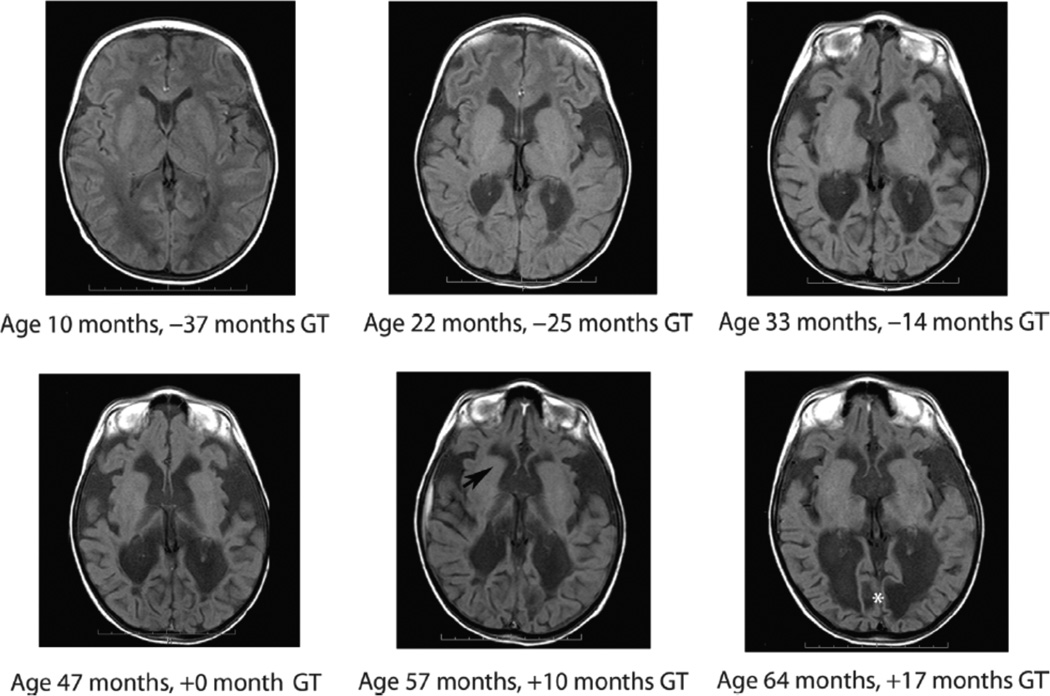
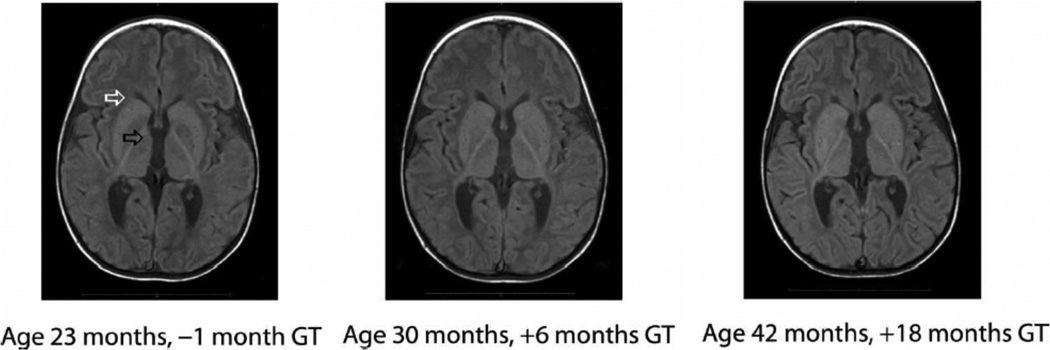
Canavan disease is a hereditary leukodystrophy caused by mutations in the aspartoacylase gene (ASPA), leading to loss of enzyme activity and increased concentrations of the substrate N-acetyl-aspartate (NAA) in the brain. Accumulation of NAA results in spongiform degeneration of white matter and severe impairment of psychomotor development. The goal of this prospective cohort study was to assess long-term safety and preliminary efficacy measures after gene therapy with an adeno-associated viral vector carrying the ASPA gene (AAV2-ASPA). Using noninvasive magnetic resonance imaging and standardized clinical rating scales, we observed Canavan disease in 28 patients, with a subset of 13 patients being treated with AAV2-ASPA. Each patient received 9 × 10(11) vector genomes via intraparenchymal delivery at six brain infusion sites. Safety data collected over a minimum 5-year follow-up period showed a lack of long-term adverse events related to the AAV2 vector. Posttreatment effects were analyzed using a generalized linear mixed model, which showed changes in predefined surrogate markers of disease progression and clinical assessment subscores. AAV2-ASPA gene therapy resulted in a decrease in elevated NAA in the brain and slowed progression of brain atrophy, with some improvement in seizure frequency and with stabilization of overall clinical status.


Figures

Fig. 1
Fig. 1
Brain NAA concentrations after gene therapy (GT). Brain NAA concentrations were measured using 1H-MRS in four brain regions after AAV2-ASPA gene therapy in 13 patients with Canavan disease. The best-fit line for NAA with the linear mixed model is shown in blue (95% CIs shown by gray lines). The normal NAA concentration reference range is shown in yellow for age-matched subjects without Canavan disease. A ramp function was fit to model the transient increase in NAA concentration that occurred in all patients before surgical administration of AAV2-ASPA. The greatest apparent treatment effect was in the periventricular region, which demonstrated a statistically significant decrease in NAA concentration over time (Wald statistic, P < 0.0001).
Fig. 2
Fig. 2
Brain atrophy measurements in Canavan disease patients after gene therapy. Brain atrophy was modeled from serial measurements of predefined landmarks using the linear mixed model approach in 13 patients with Canavan disease after AAV2-ASPA. Brain regions included the center of the third ventricle and thalami (central brain mass), the frontal lobes (frontal brain mass), the posterior horns of the lateral ventricles and parietal-occipital lobes (posterior brain mass), and the fourth ventricle and cerebellar cortex (cerebellum). Mean cortical mass is fit to the solid black line with the linear mixed model, and variability is shown with 95%CIs (dashed lines; SD, 6.00 mm).Normal reference range (vertical yellow bar), with 95%CIs, is shown for age-matched patients without Canavan disease.
Fig. 3
Fig. 3
Brain atrophy progression before gene therapy. Representative MRI images from patient 01-118-01 demonstrate that there was clinically significant progression of brain atrophy before AAV-ASPA gene therapy in some patients. In patient 01-118-01, brain atrophy was evident 3 years before gene therapy (−37 to 0 months) and may have contributed to variable treatment response. This patient was considered to be a poor responder. After gene therapy MRI images show relative stability of brain mass around the frontal horns (black arrow) but with continued progression of encephalomalacia in the occipital region (white asterisk). Brain atrophy at selected regions is shown elsewhere on a per-subject basis (fig. S2) and altogether (Fig. 2).
Fig. 4
Fig. 4
Stabilization of brain atrophy in younger patients after gene therapy. Representative MRI images from Canavan disease patient 01-118-08 after AAV2-ASPA gene therapy. The MRI images of this younger subject, who did not have brain mass loss before gene therapy and was classified as a better responder, reveal stabilization of hydrocephalus in the frontal horn region (white arrow) and third ventricle (black arrow), as well as retention of brain mass in the frontal and posterior parietal regions.

References

    1. Hagenfeldt L, Bollgren I, Venizelos N. N-acetylaspartic aciduria due to aspartoacylase deficiency—A new aetiology of childhood leukodystrophy. J. Inher. Metab. Dis. 1987;10:135–141. - PubMed
    1. Matalon R, Michals K, Sebesta D, Deanching M, Gashkoff P, Casanova J. Aspartoacylase deficiency and N-acetylaspartic aciduria in patients with Canavan disease. Am. J. Med. Genet. 1988;29:463–471. - PubMed
    1. Kaul R, Gao GP, Balamurugan K, Matalon R. Cloning of the human aspartoacylase cDNA and a common missense mutation in Canavan disease. Nat. Genet. 1993;5:118–123. - PubMed
    1. Bitto E, Bingman CA, Wesenberg GE, McCoy JG, Phillips NG., Jr. Structure of aspartoacylase, the brain enzyme impaired in Canavan disease. Proc. Natl. Acad. Sci. U.S.A. 2007;104:456–461. - PMC - PubMed
    1. Kaul R, Casanova J, Johnson AB, Tang P, Matalon R. Purification characterization and localization of aspartoacylase from bovine brain. J. Neurochem. 1991;56:129–135. - PubMed

Publication types