. 2013 Apr;155(4):727-32, 732.e1.
doi: 10.1016/j.ajo.2012.10.019. Epub 2012 Dec 17.

Combined depth imaging technique on spectral-domain optical coherence tomography

Affiliations

Combined depth imaging technique on spectral-domain optical coherence tomography

Giulio Barteselli et al. Am J Ophthalmol. 2013 Apr.

Abstract

Purpose: To describe a technique to obtain combined images of vitreoretinal and choroidal structures using spectral-domain (SD) optical coherence tomography (OCT) and to evaluate applicability in normal eyes and limitations in eyes with cataract.

Design: Prospective, observational case series.

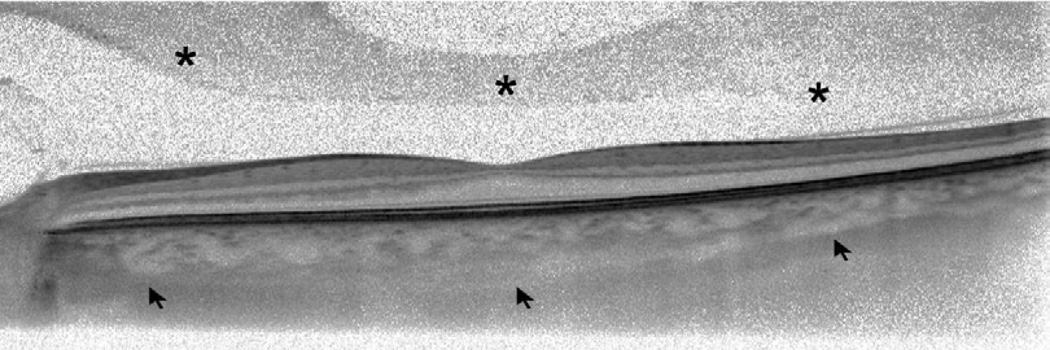
Methods: Three different foveal scans, including conventional SD OCT, enhanced depth imaging OCT and the novel method called combined depth imaging (CDI) OCT, were obtained in 42 eyes of healthy volunteers and in 26 eyes with cataract using the Heidelberg Spectralis HRA (Heidelberg Engineering). The CDI OCT images were obtained manually using an image modification process that enhances the vitreoretinal interface first and then the choroid, while averaging 100 separate OCT scans. The visualization of the inner border of the preretinal pocket and the outer border of the choroid was graded by independent masked observers for each OCT scan method.

Results: The CDI technique was able to create a good-quality combined image of the posterior structures in all the eyes, including eyes with cataract. The agreement between the grading performed by the independent observers was high for both the inner border of the vitreal pocket (κ, 0.86; P < .001) and the outer choroidal border (κ, 0.90; P < .001). CDI OCT was equivalent to conventional SD OCT in visualizing the vitreal pocket (P = .445 for normal eyes, P = .162 for eyes with cataract) and was equivalent to enhanced depth imaging OCT in visualizing the outer choroidal border (P = .660 for normal eyes, P = .329 for eyes with cataract). CDI OCT was superior to conventional SD OCT and enhanced depth imaging OCT in visualizing both of the structures (P < .001).

Conclusions: The manual technique of CDI OCT is highly sensitive to visualize posterior vitreoretinal and choroidal structures into a single full-depth image and is not affected by mild to moderate cataract.


Conflict of interest statement

Financial disclosure: All authors have completed and submitted the ICMJE form for disclosure of potential conflicts of interest. None of the authors have any financial interests to disclose.

Figures

Figure 1
Figure 1
Comparative optical coherence tomography (OCT) sections through the fovea obtained with various OCT modalities in two different eyes. (Top row) Conventional spectral domain OCT scans show good visualization on posterior vitreous structures (asterisks) but poor visualization of the outer border of the choroid. (Middle row) Enhanced depth imaging OCT scans improve visualization of the outer choroidal border (arrows) but can’t visualize details of the posterior vitreous pocket. (Bottom row) Combined depth imaging OCT scans are able to enhance visualization of both the vitreal pocket (asterisks) and the outer border of the choroid (arrows).
Figure 1
Figure 1
Comparative optical coherence tomography (OCT) sections through the fovea obtained with various OCT modalities in two different eyes. (Top row) Conventional spectral domain OCT scans show good visualization on posterior vitreous structures (asterisks) but poor visualization of the outer border of the choroid. (Middle row) Enhanced depth imaging OCT scans improve visualization of the outer choroidal border (arrows) but can’t visualize details of the posterior vitreous pocket. (Bottom row) Combined depth imaging OCT scans are able to enhance visualization of both the vitreal pocket (asterisks) and the outer border of the choroid (arrows).
Figure 2
Figure 2
Bland-Altman plots showing the level of interobserver concordance between grading of vitreal pocket visualization (Left) and grading of outer choroidal border visualization (Right). Dashed lines show mean difference and 95% limits of agreement (1.96 ± SD).
Figure 2
Figure 2
Bland-Altman plots showing the level of interobserver concordance between grading of vitreal pocket visualization (Left) and grading of outer choroidal border visualization (Right). Dashed lines show mean difference and 95% limits of agreement (1.96 ± SD).
Figure 3
Figure 3
Results of loading phase with bevacizumab for choroidal neovascularization secondary to wet age-related macular degeneration. (Left) Near-infrared image with overlaying optical coherence tomography (OCT) line passing through the fovea: the image shows a subfoveal hyper-reflective area surrounded by multiple hyper and hypo-reflective dots. (Top right) Enhanced depth imaging (EDI)-OCT shows the presence of subfoveal cystic spaces in the inner retina, focal disruption of the outer retinal layers, juxtafoveal choroidal neovascularization mushrooming into the subretinal and intraretinal spaces, and normal choroidal thickness. (Middle right) Conventional spectral domain (SD)-OCT shows that the cystic intraretinal spaces were the mechanical result of a vitreo-macular traction syndrome that was not visible on EDI-OCT; the posterior border of the choroid is not clearly visible. (Bottom right) Combined depth imaging (CDI)-OCT is able to visualize all the posterior structures in a single comprehensive image, allowing a complete clinical evaluation of the case.

References

    1. Regatieri CV, Branchini L, Fujimoto JG, Duker JS. Choroidal imaging using spectral-domain optical coherence tomography. Retina. 2012;32(5):865–876. - PMC - PubMed
    1. Spaide RF, Koizumi H, Pozzoni MC. Enhanced depth imaging spectral-domain optical coherence tomography. Am J Ophthalmol. 2008;146(4):496–500. - PubMed
    1. Povazay B, Bizheva K, Hermann B, et al. Enhanced visualization of choroidal vessels using ultrahigh resolution ophthalmic OCT at 1050 nm. Opt Express. 2003;11(17):1980–1986. - PubMed
    1. Huber R, Adler DC, Srinivasan VJ, Fujimoto JG. Fourier domain mode locking at 1050 nm for ultra-high-speed optical coherence tomography of the human retina at 236,000 axial scans per second. Opt Lett. 2007;32(14):2049–2051. - PubMed
    1. Hirata M, Tsujikawa A, Matsumoto A, et al. Macular choroidal thickness and volume in normal subjects measured by swept-source optical coherence tomography. Invest Ophthalmol Vis Sci. 2011;52(8):4971–4978. - PubMed

Publication types