. 2012 Dec 20:9:111.
doi: 10.1186/1742-4690-9-111.

HERV-H RNA is abundant in human embryonic stem cells and a precise marker for pluripotency

Affiliations

HERV-H RNA is abundant in human embryonic stem cells and a precise marker for pluripotency

Federico A Santoni et al. Retrovirology. .

Abstract

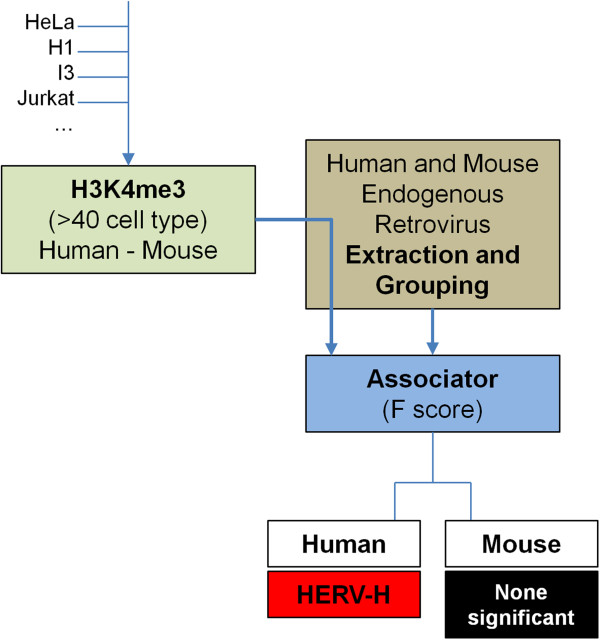
Background: Certain post-translational modifications to histones, including H3K4me3, as well as binding sites for the transcription factor STAT1, predict the site of integration of exogenous gamma-retroviruses with great accuracy and cell-type specificity. Statistical methods that were used to identify chromatin features that predict exogenous gamma-retrovirus integration site selection were exploited here to determine whether cell type-specific chromatin markers are enriched in the vicinity of endogenous retroviruses (ERVs).

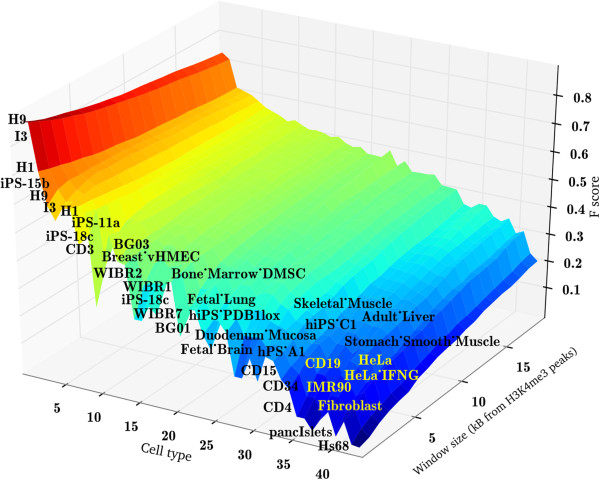
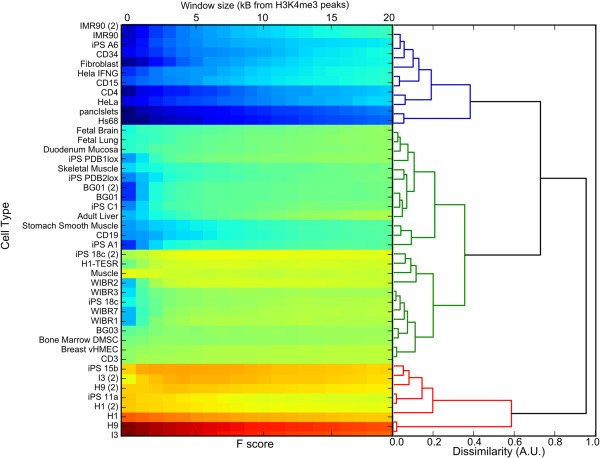
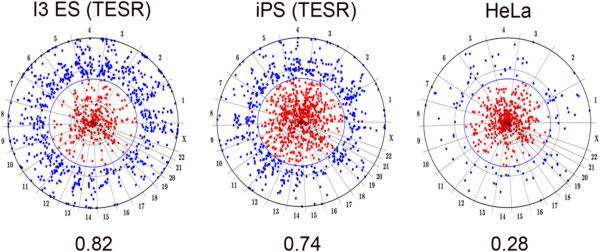
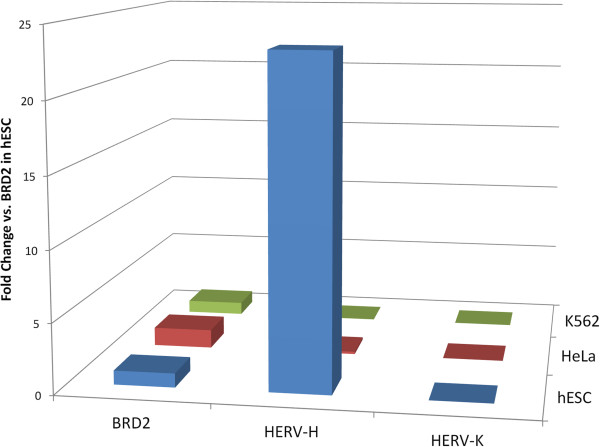
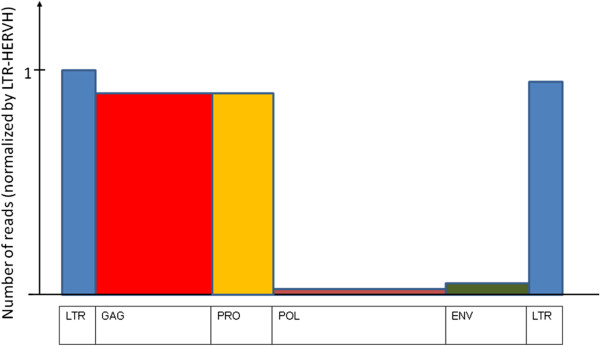
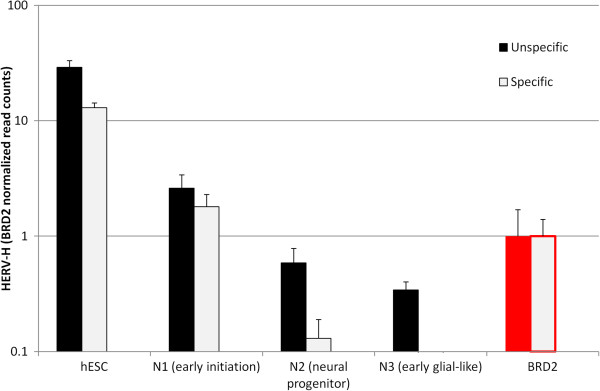
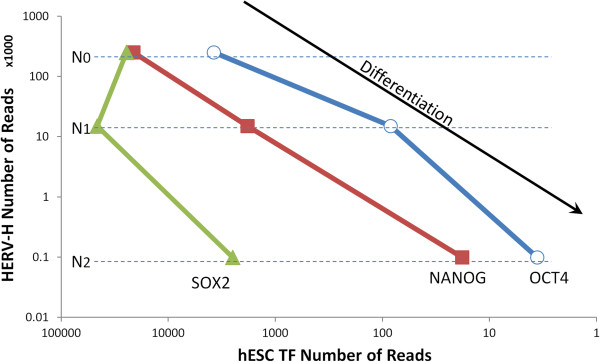
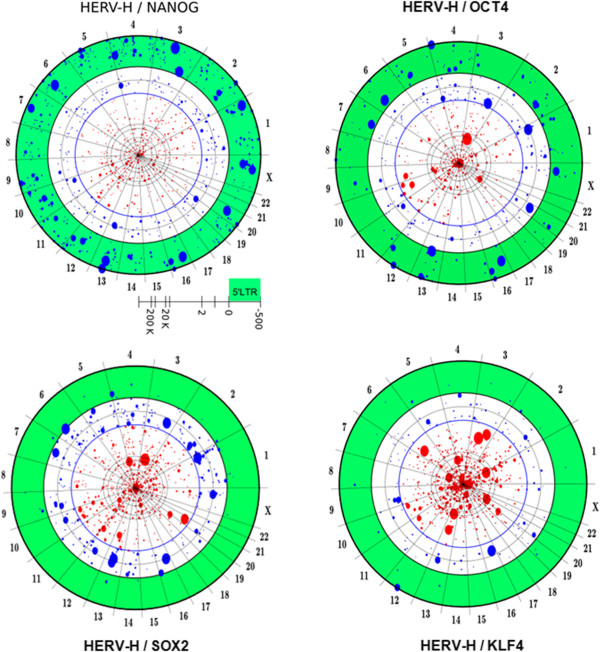
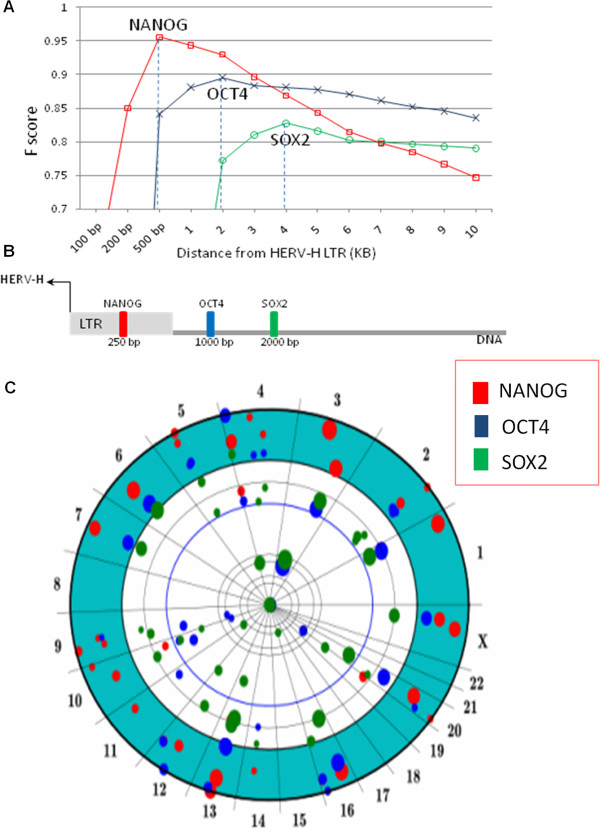
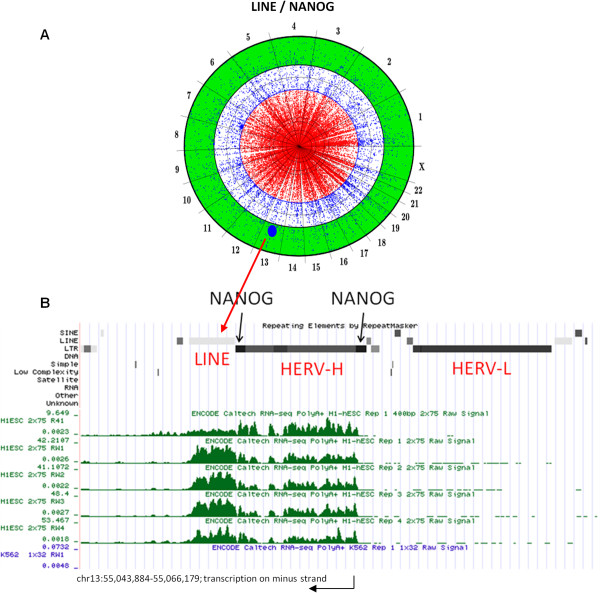
Results: Among retro-elements in the human genome, the gamma-retrovirus HERV-H was highly associated with H3K4me3, though this association was only observed in embryonic stem (ES) cells (p < 10-300) and, to a lesser extent, in induced pluripotent stem (iPS) cells. No significant association was observed in nearly 40 differentiated cell types, nor was any association observed with other retro-elements. Similar strong association was observed between HERV-H and the binding sites within ES cells for the pluripotency transcription factors NANOG, OCT4, and SOX2. NANOG binding sites were located within the HERV-H 5'LTR itself. OCT4 and SOX2 binding sites were within 1 kB and 2 kB of the 5'LTR, respectively. In keeping with these observations, HERV-H RNA constituted 2% of all poly A RNA in ES cells. As ES cells progressed down a differentiation pathway, the levels of HERV-H RNA decreased progressively. RNA-Seq datasets showed HERV-H transcripts to be over 5 kB in length and to have the structure 5'LTR-gag-pro-3'LTR, with no evidence of splicing and no intact open reading frames.

Conclusion: The developmental regulation of HERV-H expression, the association of HERV-H with binding sites for pluripotency transcription factors, and the extremely high levels of HERV-H RNA in human ES cells suggest that HERV-H contributes to pluripotency in human cells. Proximity of HERV-H to binding sites for pluripotency transcription factors within ES cells might be due to retention of the same chromatin features that determined the site of integration of the ancestral, exogenous, gamma-retrovirus that gave rise to HERV-H in the distant past. Retention of these markers, or, alternatively, recruitment of them to the site of the established provirus, may have acted post-integration to fix the provirus within the germ-line of the host species. Either way, HERV-H RNA provides a specific marker for pluripotency in human cells.


Figures

Figure 1
Figure 1
Schematic showing the strategy for detecting association between endogenous retro elements and the H3K4me3 marker. H3K4me3 CHiPSeq data for more than 40 different cell types were checked for association within 2 kB of all annotated endogenous retroviral elements (hg18) using methods described in reference [18]. Only HERV-H proviruses showed association with H3K4me3, and this was only significant in human ES cell lines. No association between H3K4me3 and endogenous retro-elements was detected in the mouse.
Figure 2
Figure 2
H3K4me3 association with HERV-H proviruses, as measured with the F score, in 40 different cell types, as a function of the distance from the marker. The F score is reported on the z-axis. Cell types are listed on the x-axis, while the window size is reported on the y-axis. Yellow to red bands indicate a significant association (F score >0.5). Significance decreases as the color shifts from red to blue. 12 out of 15 of the cell types with significant F scores are either human ES cells or iPS cells.
Figure 3
Figure 3
Hierarchical cluster analysis of the HERV-H/H3K4me3 F score, as a function of the window size (horizontal axis). F score is represented using the color scale as in Figure 2. The highly associated cluster (red tree) was made of human ES and iPS cells. The cluster with medium association (green) consisted of mesenchymal stem cells (DMSC), fetal lung and brain cells, and some iPS cells, with F scores that were barely significant. The blue cluster consisted of differentiated cells and the mean F score of 0.36 was insignificant.
Figure 4
Figure 4
Chromosome projection mandalas showing the proximity of each HERV-H provirus to the nearest site of H3K4Me3 on the chromosome, in human I3 ES cells, iPS-15b cells, and HeLa cells. Each dot on the mandala indicates an HERV-H provirus, as described in reference [18]. The angular distance around the mandala indicates the linear position of each provirus on the indicated chromosome. The radial distance from the perimeter indicates the distance of the provirus from the nearest H3K4Me3 site, in log scale from 0 to 1 megabase. Blue dots are HERV-H proviruses within 2 kB from the nearest marker. Red dots are proviruses >2 kB away from the nearest H3K4Me3 site. The association strength (F score) is written under each Mandala. F score > 0.5 constitutes a significant association.
Figure 5
Figure 5
Cumulative expression of all HERV-H proviruses in human H1 ES cells (hESC), HeLa cells, or K562 cells, compared to expression of HERV-K and BRD2, a constitutive gene with the same expression level in all three cell types. In human ES cells, HERV-H is expressed 1000-fold higher than HERV-K and 25-fold higher than BRD2. HERV-H expression is barely detectable in HeLa, and no significant HERV-H expression was detected in K562 cells. RNASeq data for this analysis were from reference [33].
Figure 6
Figure 6
Mapping of RNA-seq reads from H1 human ES cells on a schematic of the HERV-H provirus. The quantity of each RNA read was normalized to the reads corresponding to the 5 LTR. Only RNA fragments corresponding to 5LTR-gag-pro-3LTR were expressed to a significant level in human ES cells.
Figure 7
Figure 7
HERV-H expression accounts for nearly all HERV expression in human ES cells and is a not a non-specific consequence of wide-spread hypo-methylation in these cells. Quantitation of the RNA-seq reads from H1 ES cells, broken down according to the LINES, SINES, all HERVs, the nearly 1,000 HERV-H proviruses, and conventional genes. HERV-H RNA accounted for nearly all the HERV RNA in human ES cells, and 2% of total RNA. Specific vs. non-specific expression was determined by comparing the expression level of each element to the surrounding sequences.
Figure 8
Figure 8
HERV-H expression correlates with differentiation status. HERV-H expression as H1 human ES cells differentiate down a pathway towards neural progenitors and early glial cells. Black bars indicate unspecific expression; white bars represent specific expression, adjusted for expression as described in Figure 7. BRD2 has the same expression level at each stage of differentiation and was used to normalize HERV-H RNA levels.
Figure 9
Figure 9
HERV-H expression levels correlate with those of pluripotency transcription factors NANOG and OCT4 as human ES cells move down a differentiation pathway. N0, undifferentiated ES cells. N1, early initiation stage of differentiation. N2, neural progenitor stage. OCT4 and NANOG are positively correlated with HERV-H (ρ = 0.95, ρ = 0.84, respectively). SOX2 shows no correlation.
Figure 10
Figure 10
Modified chromosome projection mandalas depicting NANOG, OCT4, SOX2 and KLF4 associations with HERV-H proviruses. Mandalas were generated as described in reference [18] and Figure 4 above. The green ring indicates the HERV-H 5 LTR region (500 nucleotides from the transcriptional start site). Dot size is proportional to the expression level of each single provirus. NANOG is bound to the 5LTR of almost all highly expressed retroviruses. OCT4 shows a significant association. SOX2 binds all expressed HERV-H in a region between 1 KB and 2 KB while KLF4 does not show any significant association pattern.
Figure 11
Figure 11
Ordered spacing of pluripotency transcription factors, binding to the HERV-H 5 LTR in human ES cells. (A) Association strength (F score) of NANOG, OCT4 and SOX2 binding sites with the 50 most highly expressed HERV-H proviruses (accounting for 80% of total HERV-H expression), as a function of distance from the HERV-H transcription start site (TSS). Maxima in F score indicate the distance of greatest association. (B) Average distance of NANOG (red), OCT4 (blue) and SOX2 (green) to HERV-H TSS is shown schematically. As expected from a uniform distribution model, the average distance is half of the distance between maximal association and TSS. (C) Chromosome Projection Mandala combining NANOG, OCT4 and SOX2 with respect to 50 HERV-H proviruses. The three embryonic transcription factors bind with the same order (NANOG-OCT4-SOX2) to the promoter region of the most expressed HERV-Hs.
Figure 12
Figure 12
(A) Chromosome projection mandala depicting the association between NANOG and expressed LINEs in human ES cells. Only one LINE (large blue dot on chromosome 13) was expressed to high level in these cells. (B) The genomic region around the LINE on chromosome 13 is shown with the UCSC Genome Browser, where the linear chromosome is mapped on the horizontal axis. The position of the adjacent HERV-H and HERV-L proviruses is shown. Four biological replicates confirm HERV-H and LINE expression in human ES cells while no expression was detected in K562 cells (only one of the 4 replicates is shown). The direction of transcription was determined by strand-specific sequencing [33]. NANOG bound to both LTRs (represented with black squares along the LTR row) in the adjacent HERV-H. The adjacent HERV-L was not transcribed.

References

    1. Stoye JP. Studies of endogenous retroviruses reveal a continuing evolutionary saga. Nat Rev Microbiol. 2012;10:395–406. - PubMed
    1. Weiss RA. The discovery of endogenous retroviruses. Retrovirology. 2006;3:67. doi: 10.1186/1742-4690-3-67. - DOI - PMC - PubMed
    1. Subramanian RP, Wildschutte JH, Russo C, Coffin JM. Identification, characterization, and comparative genomic distribution of the HERV-K (HML-2) group of human endogenous retroviruses. Retrovirology. 2011;8:90. doi: 10.1186/1742-4690-8-90. - DOI - PMC - PubMed
    1. Stengel A, Roos C, Hunsmann G, Seifarth W, Leib-Mosch C, Greenwood AD. Expression profiles of endogenous retroviruses in Old World monkeys. J Virol. 2006;80:4415–4421. doi: 10.1128/JVI.80.9.4415-4421.2006. - DOI - PMC - PubMed
    1. Mi S, Lee X, Li X, Veldman GM, Finnerty H, Racie L, LaVallie E, Tang XY, Edouard P, Howes S. et al.Syncytin is a captive retroviral envelope protein involved in human placental morphogenesis. Nature. 2000;403:785–789. doi: 10.1038/35001608. - DOI - PubMed

Publication types

MeSH terms