. 2013 Jan;75(1):76-81.
doi: 10.1016/j.neures.2012.11.006. Epub 2012 Dec 17.

Probing the function of neuronal populations: combining micromirror-based optogenetic photostimulation with voltage-sensitive dye imaging

Affiliations

Probing the function of neuronal populations: combining micromirror-based optogenetic photostimulation with voltage-sensitive dye imaging

Sachiko Tsuda et al. Neurosci Res. 2013 Jan.

Abstract

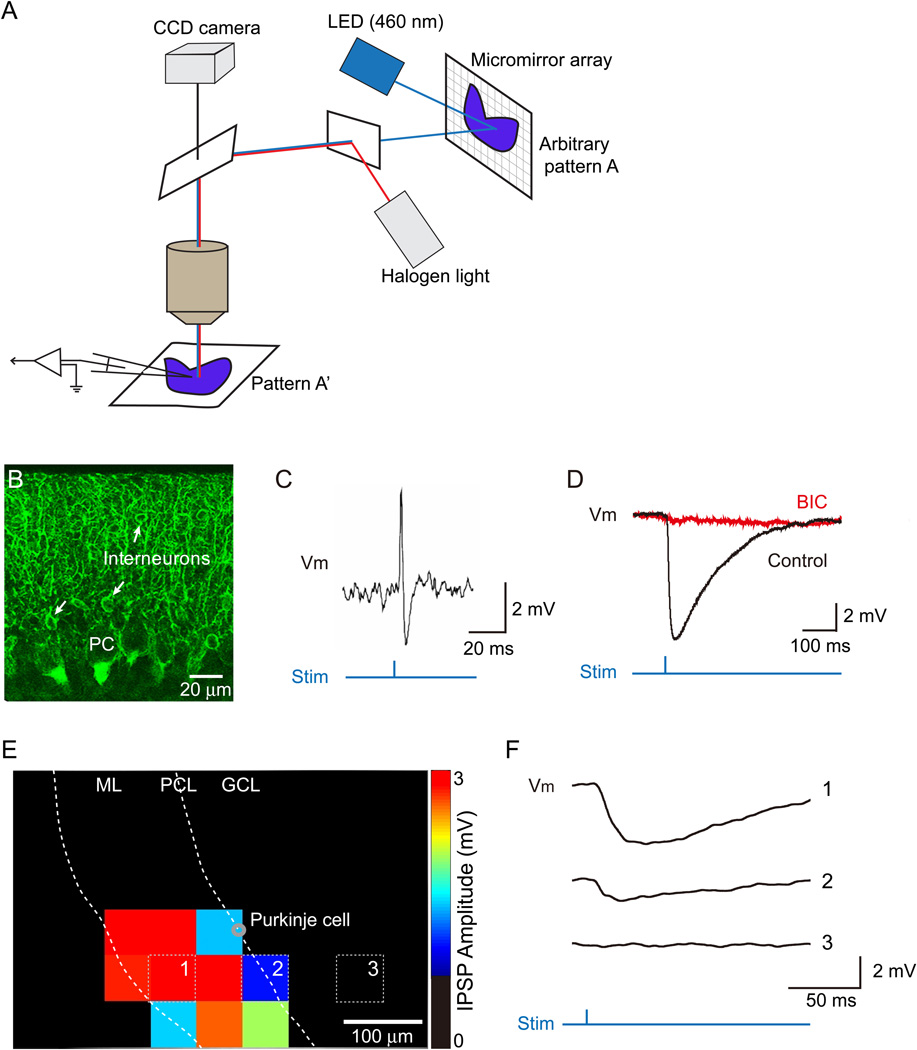
Recent advances in our understanding of brain function have come from using light to either control or image neuronal activity. Here we describe an approach that combines both techniques: a micromirror array is used to photostimulate populations of presynaptic neurons expressing channelrhodopsin-2, while a red-shifted voltage-sensitive dye allows optical detection of resulting postsynaptic activity. Such technology allowed us to control the activity of cerebellar interneurons while simultaneously recording inhibitory responses in multiple Purkinje neurons, their postsynaptic targets. This approach should substantially accelerate our understanding of information processing by populations of neurons within brain circuits.


Figures

Figure 1
Figure 1. Digital micromirror device allows photostimulation of neuronal populations and control of inhibitory synaptic connections
(A) Schematic diagram of the DMD-based all-optical system. (B) Selective expression of YFP-tagged ChR2 in molecular layer interneurons (MLIs, arrows) in the cerebellum of nNOS-ChR2-YFP mouse. (C) Photostimulation via the DMD evoked action potentials in ChR2-positive MLIs. Timing of the photostimulus is indicated below the membrane potential (Vm) recording. (D) Optogenetic control of interneuron-Purkinje cell synapses. Photostimulation of MLIs evoked IPSPs in Purkinje cells. Application of bicuculline (BIC) abolished these IPSPs, confirming their identity. (E) Optogenetic mapping of the inhibitory connection between MLIs and a Purkinje cell. Examples of Purkinje cell responses evoked when the light stimulus was located at positions indicated by white squares in E are shown in F. The amplitude of IPSCs evoked by light at a given location is depicted in E by the pseudocolor scale shown at right. Light spots are 60 µm × 60 µm in this case. Abbreviations indicate molecular layer (ML), Purkinje cell (PC), Purkinje cell layer (PCL), and granule cell layer (GCL).
Figure 2
Figure 2. All-optical control and detection of inhibition in a population of neurons
(A) Left - Fluorescence image of VSD-stained cerebellar slice, indicating the location of the Purkinje cell layer (PCL), molecular layer (ML) and granule cell layer (GCL). Right - VSD signals produced by photostimulation (Stim) of MLIs within the entire microscope field. Traces indicate signals detected at the 3 numbered locations indicated in the left image. (B) Images of changes in VSD fluorescence produced at the various indicated times after photostimulating MLIs. Changes in fluorescence (ΔF/F0) are indicated by the pseudocolor scale shown at right. (C) The hyperpolarizing signal reported in the PCL by VSD imaging was abolished by bicuculline (BIC) treatment and mostly recovered after removing the drug from the recording chamber. This indicates that the hyperpolarizing response is a Purkinje cell IPSP.
Figure 3
Figure 3. Divergence of inhibitory synaptic circuitry
(A) Light-evoked inhibitory postsynaptic potentials (IPSPs) in the Purkinje cell layer (PCL) were detected by VSD imaging. In this case, circular light spots (120 µm diameter) were used to photostimulate MLIs at different locations. Stimulus locations are indicated as white circles. (B) Trace of VSD response measured in the PCL at the location shown by the white rectangle in part (A). (C) Line scans of responses along the PCL (white dotted lines in A). Arrowhead indicates the time of photostimulation, while white lines indicate the location of photostimulating light spots. (D) Spatial distribution of light-evoked IPSPs (32 ms after the photostimulation). Blue bars indicate the locations of photostimulation. (E) A schematic diagram of convergence (top) and divergence (bottom) of the MLI-Purkinje cell circuit. Abbreviation indicates molecular layer (ML).

References

    1. Apps R, Hawkes R. Cerebellar cortical organization: a one-map hypothesis. Nature Rev. Neuroscience. 2009;10:670–681. - PubMed
    1. Berglund K, Schleich W, Krieger P, Loo LS, Wang D, Cant NB, Feng G, Augustine GJ, Kuner T. Imaging synaptic inhibition in transgenic mice expressing the chloride indicator, Clomeleon. Brain Cell Biol. 2006;35:207–228. - PMC - PubMed
    1. Bower JM. Model-founded explorations of the roles of molecular layer inhibition in regulating purkinje cell responses in cerebellar cortex: more trouble for the beam hypothesis. Front. Cell Neurosci. 2010;4 - PMC - PubMed
    1. Boyden ES, Zhang F, Bamberg E, Nagel G, Deisseroth K. Millisecond-timescale, genetically targeted optical control of neural activity. Nat. Neurosci. 2005;8:1263–1268. - PubMed
    1. Cohen D, Yarom Y. Patches of synchronized activity in the cerebellar cortex evoked by mossy-fiber stimulation: questioning the role of parallel fibers. Proc. Natl. Acad. Sci. U S A. 1998;95:15032–15036. - PMC - PubMed

Publication types

Substances