. 2013 Jan 14;210(1):143-56.
doi: 10.1084/jem.20121932. Epub 2012 Dec 17.

Follicular helper T cells serve as the major CD4 T cell compartment for HIV-1 infection, replication, and production

Affiliations

Follicular helper T cells serve as the major CD4 T cell compartment for HIV-1 infection, replication, and production

Matthieu Perreau et al. J Exp Med. .

Abstract

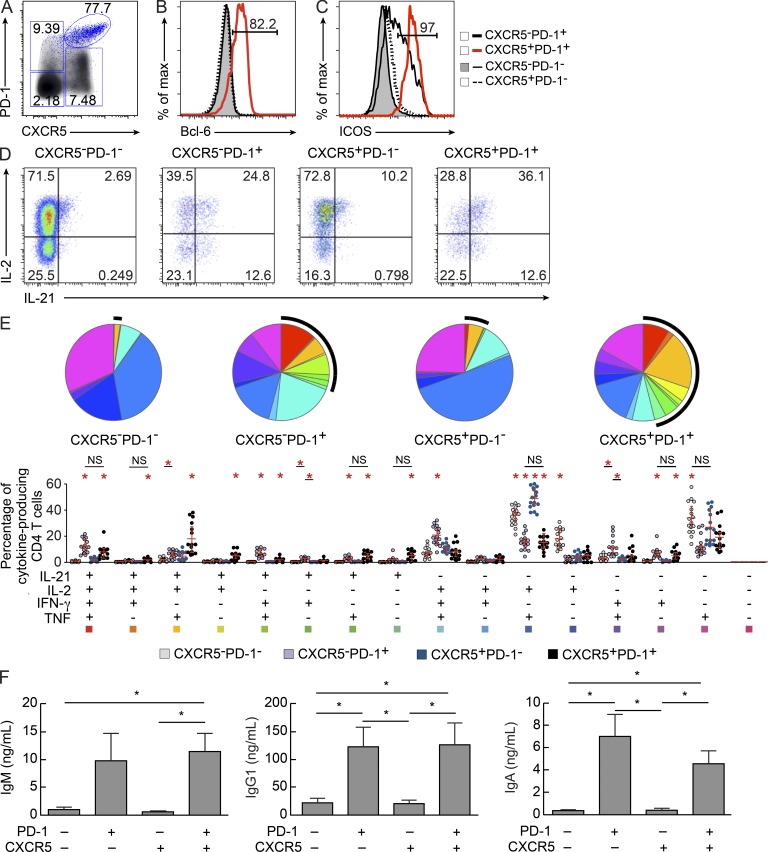
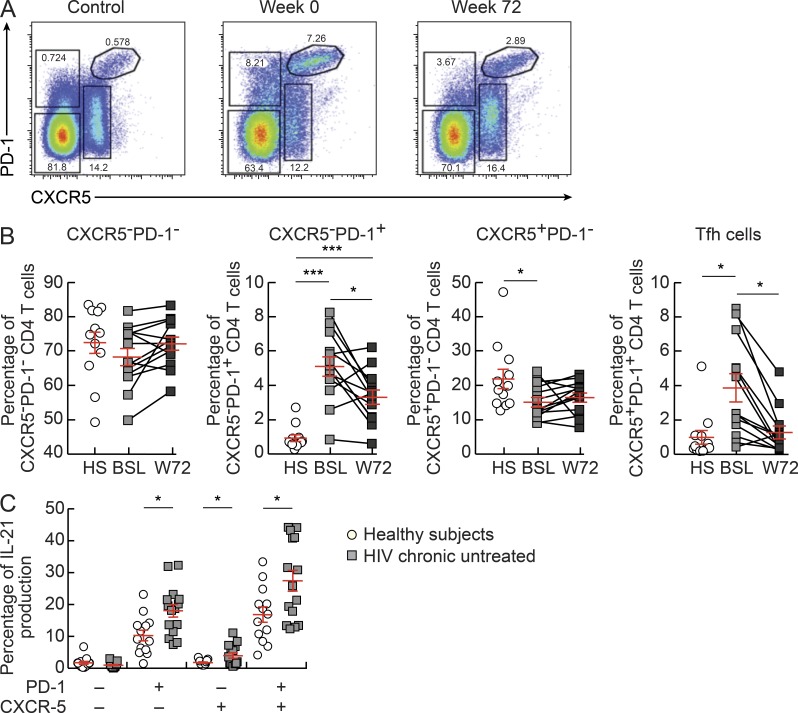
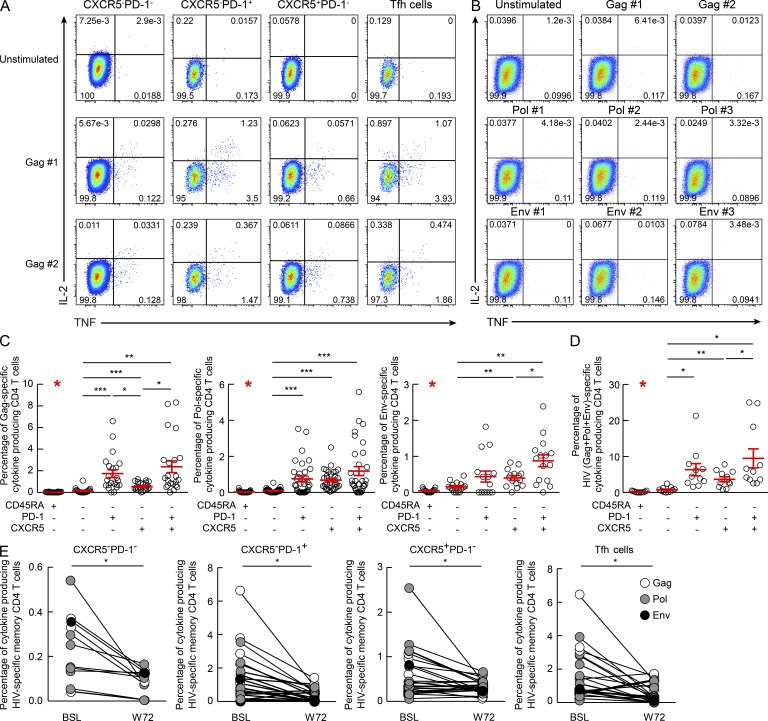
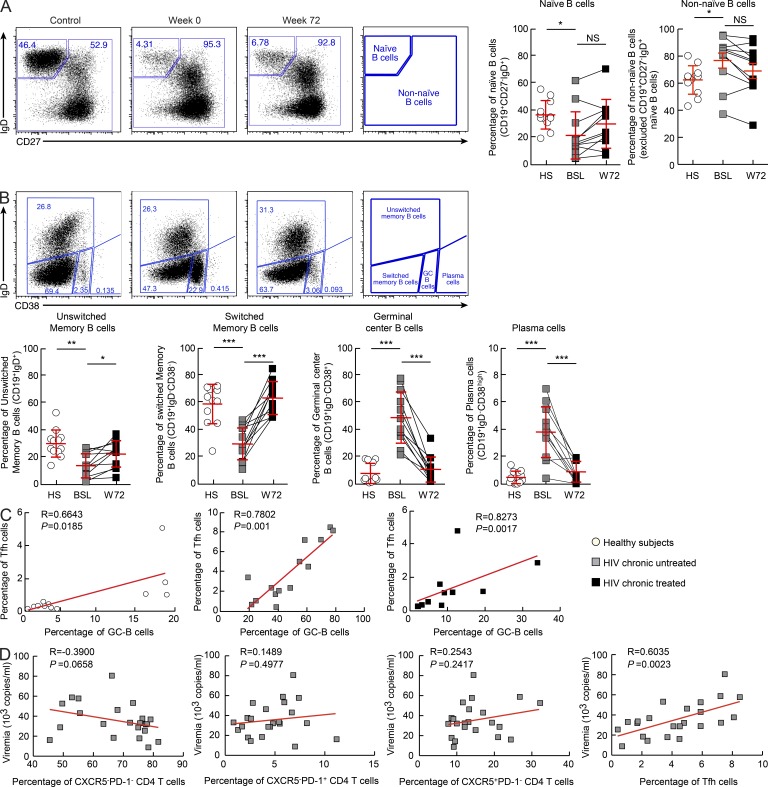
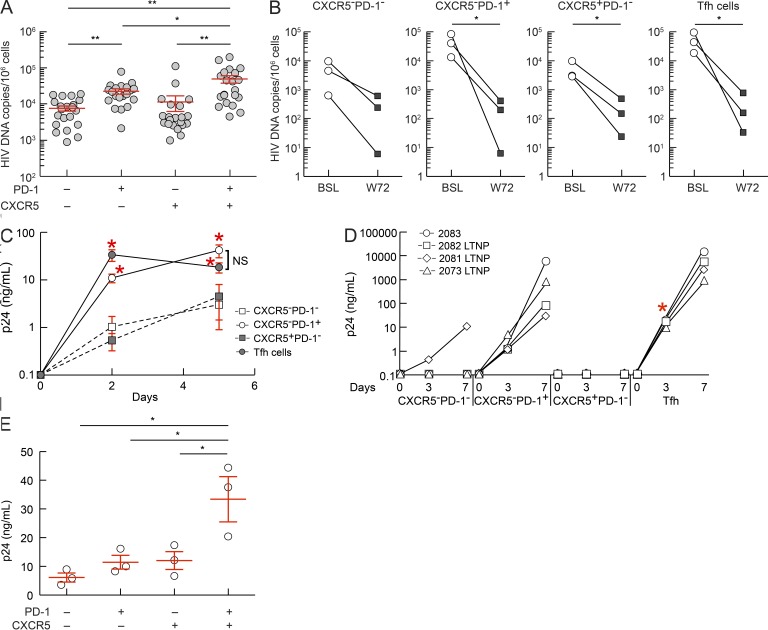
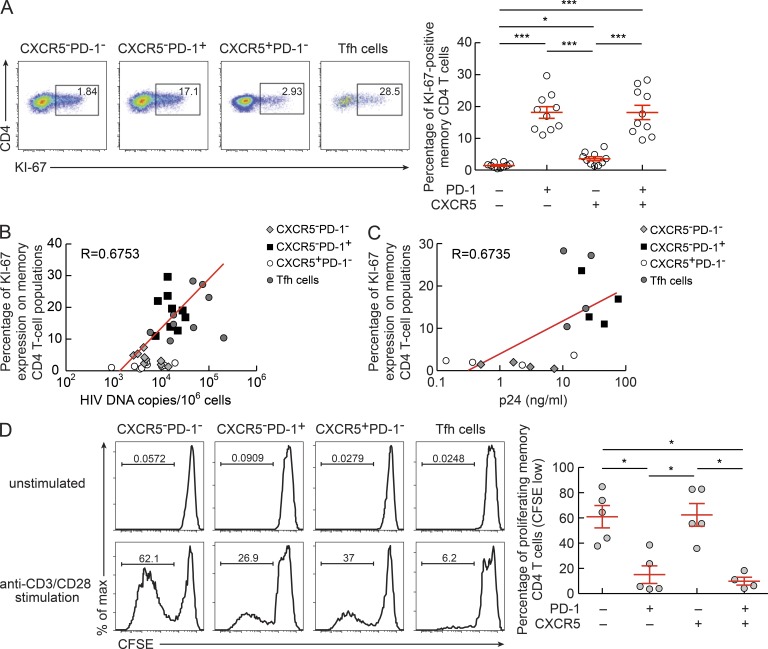
In the present study, we have investigated the distribution of HIV-specific and HIV-infected CD4 T cells within different populations of memory CD4 T cells isolated from lymph nodes of viremic HIV-infected subjects. Four memory CD4 T cell populations were identified on the basis of the expression of CXCR5, PD-1, and Bcl-6: CXCR5(-)PD-1(-)Bcl-6(-), CXCR5(+)PD-1(-)Bcl-6(-), CXCR5(-)PD-1(+)Bcl-6(-), and CXCR5(+)PD-1(+)Bcl-6(+). On the basis of Bcl-6 expression and functional properties (IL-21 production and B cell help), the CXCR5(+)PD-1(+)Bcl-6(+) cell population was considered to correspond to the T follicular helper (Tfh) cell population. We show that Tfh and CXCR5(-)PD-1(+) cell populations are enriched in HIV-specific CD4 T cells, and these populations are significantly increased in viremic HIV-infected subjects as compared with healthy subjects. The Tfh cell population contained the highest percentage of CD4 T cells harboring HIV DNA and was the most efficient in supporting productive infection in vitro. Replication competent HIV was also readily isolated from Tfh cells in subjects with nonprogressive infection and low viremia (<1,000 HIV RNA copies). However, only the percentage of Tfh cells correlated with the levels of plasma viremia. These results demonstrate that Tfh cells serve as the major CD4 T cell compartment for HIV infection, replication, and production.


Figures

Figure 1.
Figure 1.
Characterization of Tfh cells in lymph nodes. Lymph node mononuclear cells were isolated from viremic HIV-infected subjects (n = 15) and stained with anti-CD3, anti-CD4, anti-CD45RA, anti-CXCR5, anti-PD-1, anti-ICOS, and anti–Bcl-6 antibodies. (A) Representative flow cytometry profile of lymph node memory (CD45RA) CD4 T cell populations expressing CXCR5 and/or PD-1 in one viremic HIV-infected subject. Density cells in black correspond to total CD4 T cells, whereas the blue dots identify Bcl-6+CD4+ T cells. (B and C) Surface expression of Bcl-6 (B) or ICOS (C) in CXCR5PD-1, CXCR5PD-1+, CXCR5+PD-1, and CXCR5+PD-1+ memory CD4 T cell populations. (D) CD4 T cells were gated on total IFN-γ, TNF, IL-2, and IL-21 cytokine-producing cells, and IL-21 and IL-2 expression was analyzed. (E) Functional cytokine profile in CXCR5PD-1, CXCR5PD-1+, CXCR5+PD-1, and CXCR5+PD-1+ CD4 T cell populations from viremic HIV-infected subjects. All the possible combinations of the responses are shown on the x axis, and the percentage of the functionally distinct cell populations within the responding CD4 T cells are shown on the y axis. Responses are grouped and color-coded on the basis of the combinations of the cytokines produced. Spots correspond to the fractions of functionally distinct T cell populations within the total CD4 T cells. The pie charts above summarize the data, and black arcs identify IL-21–producing cell populations (*, P < 0.003). Error bars correspond to mean ± SD. (F) CXCR5PD-1, CXCR5PD-1+, CXCR5+PD-1, and CXCR5+PD-1+ CD4 T cell populations were sorted from three viremic HIV-infected subjects. Cells were cultured with autologous GC B cells (CD19+CD38+IgD) in the presence of SEB. IgM, IgG1, and IgA production was assessed at day 5 by Luminex. The grade of purity of the sorted cell populations was >97% in all experiments. *, P < 0.05. Error bars correspond to mean ± SEM. Statistical significance was obtained using Student’s t test.
Figure 2.
Figure 2.
Frequencies of Tfh cells in lymph nodes. (A) Representative flow cytometry profiles of CXCR5 and/or PD-1 expression in CD4 T cell populations from an HIV-negative subject (control) and from one HIV-infected subject before (week 0) and after ART (week 72). (B) Frequencies of CXCR5PD-1, CXCR5PD-1+, CXCR5+PD-1, and Tfh CD4 T cell populations in HIV-negative subjects (HS; n = 12) and chronically HIV-1–infected subjects (n = 13) at weeks 0 (BSL) and 72 (W72). (C) Frequencies of IL-21–producing cells in HIV-negative (n = 13; open circles) and viremic HIV-infected (n = 15; closed squares) subjects. Cells were stimulated with PMA plus ionomycin for 6 h, permeabilized, and stained with anti-CD3, anti-CD4, anti–IL-21, anti–IFN-γ, anti-TNF, and anti–IL-2 antibodies. *, P < 0.05; ***, P < 0.0001. Error bars correspond to mean ± SEM. Statistical significance was obtained using one-way ANOVA (Kruskal-Wallis test) followed by Student’s t test.
Figure 3.
Figure 3.
Flow cytometry profiles of HIV-specific lymph node CD4 T cell populations. Lymph node mononuclear cells were isolated from viremic HIV-infected subjects before (week 0; n = 11) or after (week 72; n = 5) ART therapy and were stimulated or not with HIV peptide pools (Gag, Pol, and Env), and then permeabilized and stained with anti-CD3, anti-CD4, anti-CD45RA, anti–PD-1, anti-CXCR5, anti–IL-21, anti–IFN-γ, anti-TNF, and anti–IL-2 antibodies. (A and B) Representative flow cytometric cytokine profiles of Gag peptide pool #1 (Gag #1) and Gag #2–specific CD4 T cell populations producing IL-2 and/or TNF from one viremic HIV-positive subject in the memory (A) and naive T cell populations (B). (C and D) Percentage of Gag-, Pol-, and Env-specific (C) and of HIV-specific (Gag+Pol+Env; D) T cells among total CD3+CD4+ T cells making any cytokine (IFN-γ, TNF, IL-2, or IL-21) in viremic HIV-infected subjects before ART therapy (n = 11). Error bars correspond to mean ± SEM. (E) Changes in the frequencies of the HIV-specific memory CD4 T cells producing anyone cytokine in viremic HIV-infected subjects before (week 0; BSL) and after (week 72; W72) ART therapy (n = 5). *, P < 0.05; **, P < 0.001; ***, P < 0.0001. Statistical significance was obtained using Student’s t test.
Figure 4.
Figure 4.
Frequencies of B cell populations in lymph nodes of HIV-negative and viremic untreated and treated HIV-infected subjects. Lymph node mononuclear cells were isolated from HIV-negative subjects (n = 12, control) and from HIV-infected subjects (n = 11) at weeks 0 and 72 and were stained with anti-CD19, anti-CD27, anti-CD38, and anti-IgD antibodies. (A) Representative flow cytometry profile of naive and non-naive B cells based on the expression of CD19+, CD27, and IgD+. Graphs show cumulative percentages of naive and non-naive B cell populations in HIV-negative subjects (HS; n = 12) and HIV-positive subjects (n = 11) at weeks 0 (BSL) and 72 (W72). (B) Representative flow cytometry profile of non-naive B cell populations based on the expression of CD19, IgD, and CD38. Naive B cells (CD19+IgD+CD27) were excluded. Plots show unswitched memory (CD19+IgD+), switched memory (CD19+IgDCD38), GC (CD19+IgDCD38+), and plasma cell (CD19+IgDCD38high) B cell populations in one HIV-negative subject (control) and one HIV-positive subject at weeks 0 and 72. Graphs show cumulative data of the different memory B cell populations of HIV-negative subjects (n = 12) and of HIV-positive subjects (HS, n = 11) at weeks 0 (BSL) and 72 (W72). (C) Correlation between the percentage of Tfh cells and GC B cells in HIV-negative subjects (n = 12; open circles) and HIV-infected subjects before (chronic untreated; n = 14; gray squares) and after ART therapy (chronic treated; n = 11; black squares). (D) Correlation between the percentage of CXCR5PD-1, CXCR5PD-1+, CXCR5+PD-1, or Tfh cells and plasma viremia in viremic chronically HIV-infected subjects (n = 23). *, P < 0.05; **, P < 0.001; ***, P < 0.0001. Error bars correspond to mean ± SD. P-values were derived from Student’s t test for multiple comparisons (B), or a Spearman rank test for correlations (C and D).
Figure 5.
Figure 5.
HIV DNA load and HIV production in lymph node CD4 T cell populations. (A) HIV DNA load in sorted CXCR5PD-1, CXCR5PD-1+, CXCR5+PD-1, and CXCR5+PD-1+ memory (CD45RA) CD4 T cell populations from viremic HIV-infected subjects (n = 21). (B) HIV DNA load before (week 0; BSL) and after (week 72; W72) ART therapy in three HIV-infected subjects. (C) CXCR5PD-1, CXCR5PD-1+, CXCR5+PD-1, and CXCR5+PD-1+ memory CD4 T cell populations were sorted from HIV-infected subjects with viremia >15,000 HIV RNA copies/ml (n = 5), and HIV replication was assessed at days 0, 2, and 5 after anti-CD3 plus anti-CD28 stimulation by measuring p24 production using an electrochemiluminescence assay. (D) CXCR5PD-1, CXCR5PD-1+, CXCR5+PD-1, and CXCR5+PD-1+ memory CD4 T cell populations were sorted from four HIV-infected subjects (n = 4) with low viremia (<2,000 HIV RNA copies/ml) and cultured with heterologous CD8-depleted blood mononuclear cells. HIV production was assessed at days 0, 3, and 7 after anti-CD3 plus anti-CD28 stimulation. The different symbols represent individual subjects. (E) Productive HIV infection in sorted CXCR5PD-1, CXCR5PD-1+, CXCR5+PD-1, and CXCR5+PD-1+ memory CD4 T cell populations of healthy subjects (n = 3) 3 d after anti-CD3 plus anti-CD28 stimulation. *, P < 0.05; **, P < 0.001. Error bars correspond to mean ± SEM. P-values were obtained using one-way ANOVA (Kruskal-Wallis test) followed by Student’s t test.
Figure 6.
Figure 6.
Ki-67 expression and cell proliferation in lymph node CD4 T cells. Lymph node mononuclear cells isolated from viremic chronically HIV-1–infected subjects (n = 10) were permeabilized and stained with anti-CD3, anti-CD4, anti-CD45RA, and anti–Ki-67 antibodies. (A) Representative flow cytometry profiles showing Ki-67 expression in CD4 T cell populations. Graph shows data from 10 viremic HIV-infected subjects. (B) Correlation between Ki-67 expression and HIV-1 DNA copies/106 cells (n = 9). (C) Correlation between Ki-67 expression and p24 production (n = 4). (D) Representative flow cytometry profile showing proliferating (CFSE low) CXCR5PD-1, CXCR5PD-1+, CXCR5+PD-1, and CXCR5+PD-1+ CD4 T cell populations. Sorted memory (CD45RA) CD4 T cell populations from viremic HIV-infected subjects (n = 5) were labeled with CFSE and stimulated with anti-CD3 plus anti-CD28 antibodies for 5 d and acquired on an LSR SORP (BD). Flow cytometry profiles of unstimulated cells (negative control) are also shown. *, P < 0.05; ***, P < 0.0001. Error bars correspond to mean ± SEM. P-values were obtained using Student’s t test for multiple comparisons (A and D), or a Spearman rank test for correlations (B and C).

References

    1. Allen C.D., Okada T., Cyster J.G. 2007. Germinal-center organization and cellular dynamics. Immunity. 27:190–202 10.1016/j.immuni.2007.07.009 - DOI - PMC - PubMed
    1. Avery D.T., Deenick E.K., Ma C.S., Suryani S., Simpson N., Chew G.Y., Chan T.D., Palendira U., Bustamante J., Boisson-Dupuis S., et al. 2010. B cell–intrinsic signaling through IL-21 receptor and STAT3 is required for establishing long-lived antibody responses in humans. J. Exp. Med. 207:155–171 10.1084/jem.20091706 - DOI - PMC - PubMed
    1. Bentebibel S.E., Schmitt N., Banchereau J., Ueno H. 2011. Human tonsil B-cell lymphoma 6 (BCL6)-expressing CD4+ T-cell subset specialized for B-cell help outside germinal centers. Proc. Natl. Acad. Sci. USA. 108:E488–E497 10.1073/pnas.1100898108 - DOI - PMC - PubMed
    1. Betts M.R., Ambrozak D.R., Douek D.C., Bonhoeffer S., Brenchley J.M., Casazza J.P., Koup R.A., Picker L.J. 2001. Analysis of total human immunodeficiency virus (HIV)-specific CD4(+) and CD8(+) T-cell responses: relationship to viral load in untreated HIV infection. J. Virol. 75:11983–11991 10.1128/JVI.75.24.11983-11991.2001 - DOI - PMC - PubMed
    1. Breitfeld D., Ohl L., Kremmer E., Ellwart J., Sallusto F., Lipp M., Förster R. 2000. Follicular B helper T cells express CXC chemokine receptor 5, localize to B cell follicles, and support immunoglobulin production. J. Exp. Med. 192:1545–1552 10.1084/jem.192.11.1545 - DOI - PMC - PubMed

Publication types

MeSH terms