. 2013 Jan 14;210(1):99-114.
doi: 10.1084/jem.20121172. Epub 2012 Dec 17.

Up-regulation of a death receptor renders antiviral T cells susceptible to NK cell-mediated deletion

Affiliations

Up-regulation of a death receptor renders antiviral T cells susceptible to NK cell-mediated deletion

Dimitra Peppa et al. J Exp Med. .

Abstract

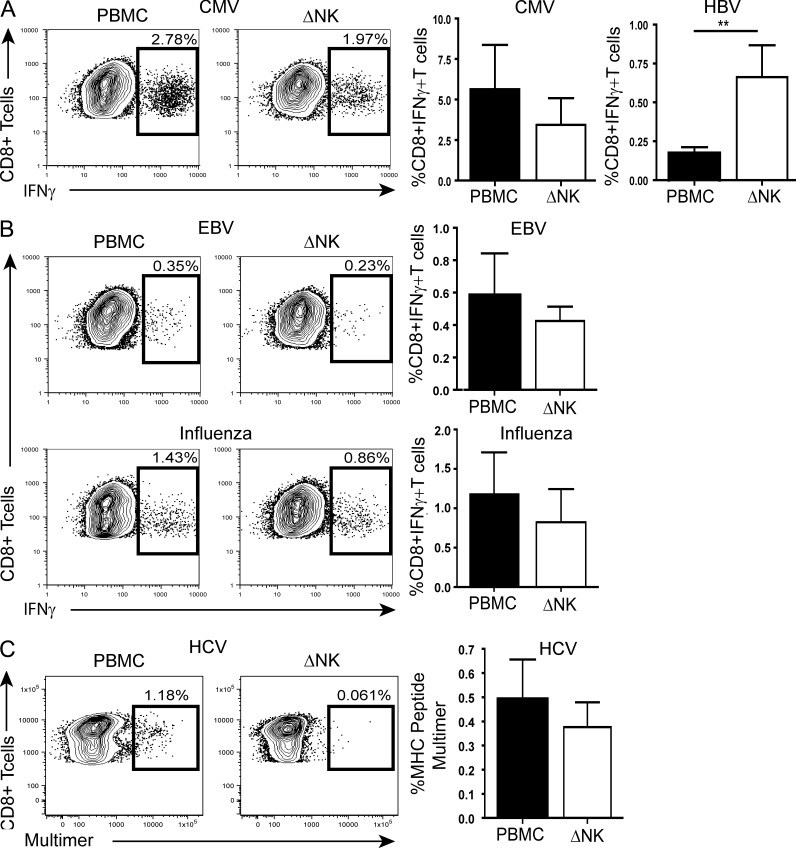
Antiviral T cell responses in hepatotropic viral infections such as hepatitis B virus (HBV) are profoundly diminished and prone to apoptotic deletion. In this study, we investigate whether the large population of activated NK cells in the human liver contributes to this process. We show that in vitro removal of NK cells augments circulating CD8(+) T cell responses directed against HBV, but not against well-controlled viruses, in patients with chronic hepatitis B (CHB). We find that NK cells can rapidly eliminate HBV-specific T cells in a contact-dependent manner. CD8(+) T cells in the liver microcirculation are visualized making intimate contact with NK cells, which are the main intrahepatic lymphocytes expressing TNF-related apoptosis-inducing ligand (TRAIL) in CHB. High-level expression of the TRAIL death receptor TRAIL-R2 is found to be a hallmark of T cells exposed to the milieu of the HBV-infected liver in patients with active disease. Up-regulation of TRAIL-R2 renders T cells susceptible to caspase-8-mediated apoptosis, from which they can be partially rescued by blockade of this death receptor pathway. Our findings demonstrate that NK cells can negatively regulate antiviral immunity in chronic HBV infection and illustrate a novel mechanism of T cell tolerance in the human liver.


Figures

Figure 1.
Figure 1.
Recovery of HBV-specific CD8+ T cells after depletion of NK cells. (A) Representative FACS plots from a CHB patient. HBV-specific CD8+ T cells were identified by intracellular cytokine staining for IFN-γ after 10-d stimulation with a pool of HBV peptides of PBMCs or PBMCs depleted of NK cells (ΔNK). Where indicated, a physiological ratio of NK cells was re-added in the culture at day 0 before stimulation. (B) Individual responses of CHB patients (n = 27) and matched summary data (C). (D) NK cells were sorted to 99% purity by flow cytometry. Control PBMCs stained with the same antibodies were passed though the machine untouched. Summary bar graph of (n = 3) experiments. (E) HBV-specific CD8+ T cells were identified by MHC peptide multimer staining after short-term peptide stimulation in the absence or presence of NK cells or NK cell re-addition at day 0. Representative FACS plots from a CHB patient and summary data from (n = 9) CHB patients. Error bars represent the mean ± SEM. ND = not detected. ***, P < 0.001; **, P < 0.01.
Figure 2.
Figure 2.
Differential regulation by NK cells according to T cell specificity. (A) Representative FACS plots for CMV-specific responses from a CHB patient upon PBMC stimulation and in the absence of NK cells (ΔNK) and summary bar graphs comparing CD8+ T cell responses upon HBV or CMV peptide stimulation within the same (n = 22) CHB patients ± NK cell depletion. (B) Representative FACS plots for EBV and influenza virus–specific responses from a CHB patient upon PBMC stimulation and in the absence of NK cells (ΔNK) and summary data for EBV (n = 6) and influenza (n = 7). (C) Example of HCV virus–specific CD8+ T cell identification by tetramer staining during short-term culture in the presence and absence of NK cells and summary bar graph from n = 8 HCV patients. Error bars represent the mean ± SEM. **, P < 0.01.
Figure 3.
Figure 3.
NK cells limit the survival of CD8+ HBV-specific T cells in a contact-dependent manner by inducing apoptosis. (A) Representative FACS plots from a CHB patient. HBV-specific CD8+ T cells were identified by intracellular cytokine staining for IFN-γ after 10-d stimulation with a pool of HBV peptides upon NK cell depletion (ΔNK) or re-addition of freshly purified NK cells (physiological ratio) at day 0 or 10. Summary data from (n = 4) CHB patients. (B) FACS plots from a CHB patient depicting HBV-specific CD8+ T cells identified by multimer staining, after depletion of NK cells at day 0, or from PBMC culture at 24 h (Day 1) and re-addition of freshly purified NK cells at a physiological ratio on day 0 or 10. Summary bar graphs of n = 5 experiments. (C, top) Representative FACS plots from a CHB patient. HBV-specific CD8+ T cells were identified by multimer staining after short-term peptide stimulation in the absence (ΔNK) or presence of NK cells. NK cells, where indicated, were re-added at a physiological ratio directly in the culture or were plated into transwells to prevent contact. (bottom) The corresponding proportions of apoptotic virus-specific cells. The degree of pancaspase activation was determined by flow cytometry using the carboxyfluorescein-FLICA apoptosis detection kit. Histograms represent early apoptotic (FLICA+7AAD) and late apoptotic (FLICA+7AAD+) virus-specific CD8+ T cells. (D) Summary stacked bars of n = 3 experiments.
Figure 4.
Figure 4.
Higher levels of TRAIL-R2 on T cells in patients with CHB. (A) Representative FACS plots and isotype control from a healthy individual and a CHB patient showing expression of TRAIL-R2 on global peripheral CD8+ T cells, and summary data from n = 18 healthy and n = 27 CHB patients. (B) FACS plots depicting identification of virus-specific CD8+ T cells ex vivo via multimer staining from a representative CHB patient, and gating strategy showing expression of TRAIL-R2 on virus-specific cells. A control multimer was used to help identify the virus-specific populations. (C) Paired data showing expression of TRAIL-R2 on HBV versus CMV virus-specific CD8+ T cells from (n = 9) CHB patients. (D) Representative FACS plot from an individual with resolved HBV infection, showing gating for HBV-specific CD8+ T cells and TRAIL-R2 expression. (E) Summary bar graphs of TRAIL-R2 expression on HBV-specific CD8+ T cells from seven individuals with resolved HBV infection and nine CHB individuals. Error bars represent the mean ± SEM. *, P < 0.05; **, P < 0.01.
Figure 5.
Figure 5.
Intrahepatic CD8+ T cells in CHB patients have up-regulated expression of TRAIL-R2. (A) Representative example of immunostaining of paraffin-embedded liver tissue (derived from a CHB patient undergoing diagnostic biopsy) showing CD8+ T cells and TRAIL-R2 colocalization by immunofluorescence. Bars, 20 µm. (B) Representative FACS plots from a CHB patient showing ex vivo expression of TRAIL-R2 on global peripheral and intrahepatic CD8+ T cells. (C) Ex vivo TRAIL-R2 expression on paired peripheral and intrahepatic global CD8+ T cells from (n = 21) patients with CHB. (D) Correlation of TRAIL-R2 expression on intrahepatic CD8+ T cells and HBV viral load. Spearman r = 0.4870, P value (two-tailed) = 0.02 (E) Comparison of TRAIL-R2 expression on intrahepatic CD8+ T cells from 8 patients with nonviral hepatitis (control), 7 HCV-infected patients, and 21 CHB patients. (F) Co-staining for TRAIL-R2 and HLADR gated on intrahepatic global CD8+ T cells directly ex vivo from a CHB patient, a HCV patient, and a nonviral hepatitis control patient; and summary data from control (n = 5), HCV (n = 6), and CHB (n = 10) patients. ***, P < 0.001; **, P < 0.01; *, P < 0.05.
Figure 6.
Figure 6.
TRAIL-R2 expression is a feature of CD8+ T cells encountering antigen in the HBV-infected liver. (A) Representative gating strategy identifying intrahepatic TRAIL-R2+ high (red), TRAIL-R2+ low (black), and TRAIL-R2 negative (gray) CD8+ T cells from a CHB patient. Histograms and bars depict the proportions of CD38 (n = 4), Annexin V (n = 3), PD1 (n = 6), and CD57 (n = 8) expressed by each subset directly ex vivo. (B) The maturation status of intrahepatic TRAIL-R2+ high (red), TRAIL-R2+ low (black), and TRAIL-R2 negative (gray) CD8+ T cells were analyzed by co-staining for CD27 and CD45RA. Representative FACS plot and summary bars of frequencies of expression of TRAIL-R2+ high (red), TRAIL-R2+ low (black), and TRAIL-R2 negative (gray) CD8+ T cells with naive, central memory (CM), effector memory (EM) and revertant (EMRA) phenotypes from n = 4 CHB patients. (C) Summary bar graphs comparing expression of TRAIL-R2 on global intrahepatic CD8+ T cells, CMV-specific and HBV-specific CD8+ T cells. Virus-specific CD8+ T cells were identified directly ex vivo by multimer staining in (n = 5) HLA-A2+ CHB patients with available liver biopsies. (D) Representative examples of the gating strategy from a control patient with no evidence of viral hepatitis (control liver) and a CHB patient (HBV liver) showing expression of TRAIL-R2 on intrahepatic global CD8+ T cells and virus-specific CD8+ T cells identified via IFN-γ staining after overnight stimulation with CMV peptide and HBV overlapping peptides (OLP), respectively. Summary bar graphs comparing expression of TRAIL-R2 on CMV-specific CD8+ T cells from control livers (n = 5) versus CMV and HBV-specific CD8+ T cells from (n = 5) CHB patients. Bars represent the mean ± SEM. *, P < 0.05.
Figure 7.
Figure 7.
Partial recovery HBV-specific CD8+ T cells to TRAIL blockade. (A) Representative FACS plots from a CHB patient after short-term peptide stimulation of PBMCs in thepresence or absence of NK cells and in the presence of TRAIL-R2/Fc blocking or IgG1-Fc control. Plotted are summary paired data from (n = 9) CHB patients. (B) Representative FACS plot and summary data from n = 6 CHB patients showing the effect of TRAIL-R2 Fc addition at the time of PMBC stimulation with CMV peptide during short-term culture. (C) Representative example from a CHB patient demonstrating the expression of TRAIL-R2 on global CD8+ T cells in the presence or absence (ΔNK) of NK cells after short-term culture with HBV peptides and summary data from (n = 19) CHB patients. Bars represent the mean ± SEM ***, P < 0.001; **, P < 0.01; *, P < 0.05.
Figure 8.
Figure 8.
Overnight recovery of intrahepatic HBV-specific T cells by TRAIL blockade. (A) Examples of NK cells (NKp46 in blue) in intimate contact with CD3+ T cells (red) in the sinusoidal spaces of a representative HBV-infected liver. Immunohistochemistry was performed on paraffin-embedded HBV tissue. Bars 20 µm. (B) Representative FACS plot from a CHB patient and gating strategy showing expression of caspase 8 in intrahepatic TRAIL-R2+ CD8+ T cells ex vivo and summary bar graphs comparing expression of caspase 8 in global CD8+ T cells versus TRAIL-R2+ CD8+ T cells (n = 5). Only live events were analyzed. (C) Representative FACS plots showing response to TRAIL blockade after overnight incubation of intrahepatic cells with overlapping (OLP) HBV peptides and individual intrahepatic responses from nine CHB patients with available liver tissue.

References

    1. Alter G., Heckerman D., Schneidewind A., Fadda L., Kadie C.M., Carlson J.M., Oniangue-Ndza C., Martin M., Li B., Khakoo S.I., et al. 2011. HIV-1 adaptation to NK-cell-mediated immune pressure. Nature. 476:96–100 10.1038/nature10237 - DOI - PMC - PubMed
    1. Andrews D.M., Estcourt M.J., Andoniou C.E., Wikstrom M.E., Khong A., Voigt V., Fleming P., Tabarias H., Hill G.R., van der Most R.G., et al. 2010. Innate immunity defines the capacity of antiviral T cells to limit persistent infection. J. Exp. Med. 207:1333–1343 10.1084/jem.20091193 - DOI - PMC - PubMed
    1. Boni C., Fisicaro P., Valdatta C., Amadei B., Di Vincenzo P., Giuberti T., Laccabue D., Zerbini A., Cavalli A., Missale G., et al. 2007. Characterization of hepatitis B virus (HBV)-specific T-cell dysfunction in chronic HBV infection. J. Virol. 81:4215–4225 10.1128/JVI.02844-06 - DOI - PMC - PubMed
    1. Bouillet P., O’Reilly L.A. 2009. CD95, BIM and T cell homeostasis. Nat. Rev. Immunol. 9:514–519 10.1038/nri2570 - DOI - PubMed
    1. Cerboni C., Zingoni A., Cippitelli M., Piccoli M., Frati L., Santoni A. 2007. Antigen-activated human T lymphocytes express cell-surface NKG2D ligands via an ATM/ATR-dependent mechanism and become susceptible to autologous NK- cell lysis. Blood. 110:606–615 10.1182/blood-2006-10-052720 - DOI - PubMed

Publication types

MeSH terms

Substances