. 2012 Dec 20;3(12):e446.
doi: 10.1038/cddis.2012.183.

Senescence-associated secretory phenotype favors the emergence of cancer stem-like cells

Affiliations

Senescence-associated secretory phenotype favors the emergence of cancer stem-like cells

J Cahu et al. Cell Death Dis. .

Abstract

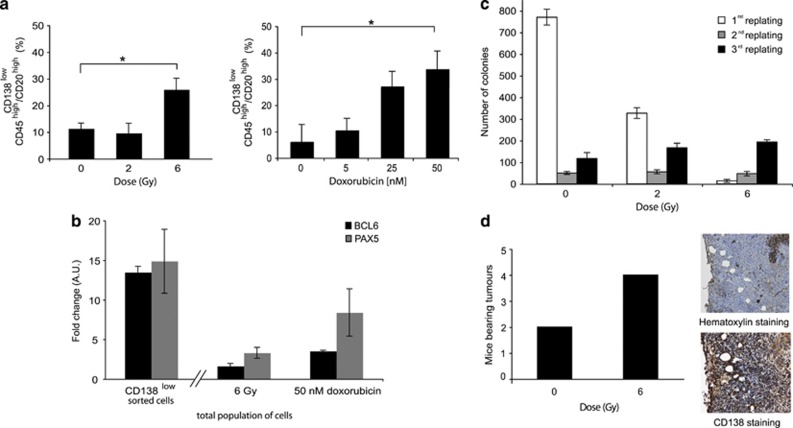
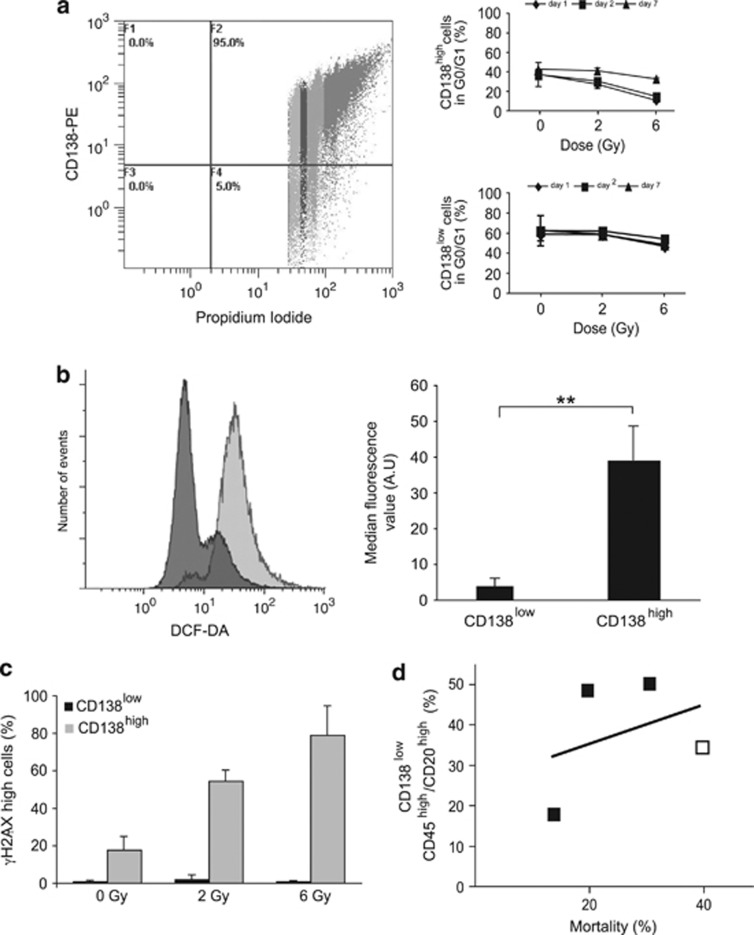
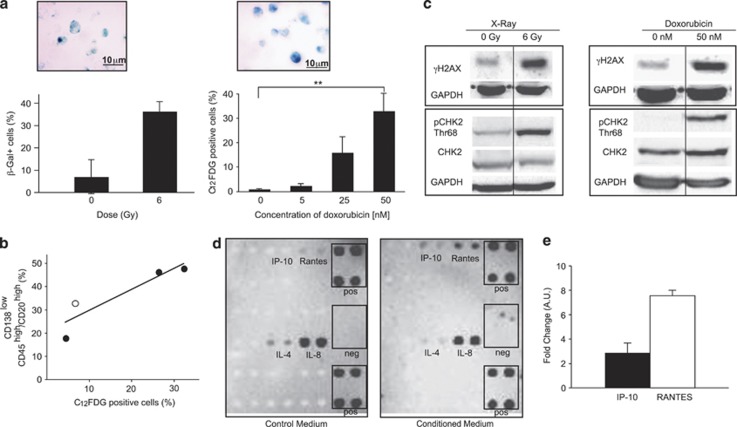
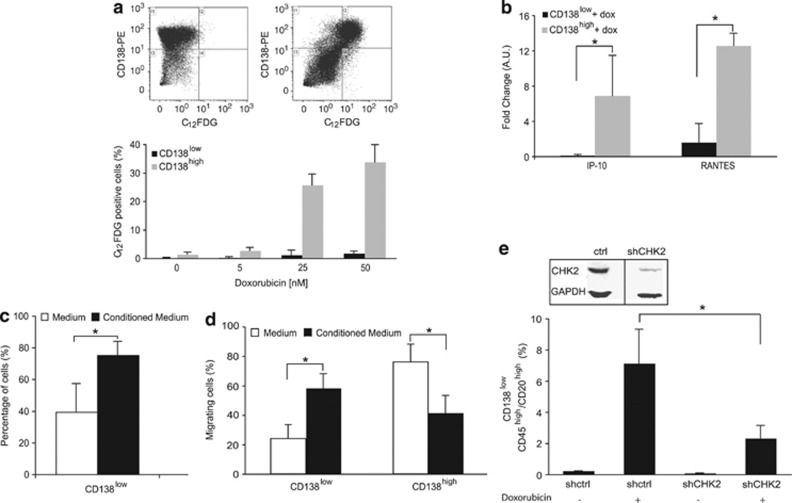
The molecular mechanisms underlying cancer resistance remain elusive. One possible explanation is that cancer stem cells (CSCs) elude drug treatment, emerge and reproduce a tumor. Using multiple myeloma as a paradigm, we showed that cancer stem-like cells (CSLCs) appear after genotoxic stress because of their intrinsic properties. However, these properties do not drive the emergence of the CSLCs. Following genotoxic stress, remaining DNA damages lead to a senescence-associated secretory phenotype (SASP). Senescent cells, which are the non-CSLCs, secrete chemokines contributing to the emergence, maintenance and migration of CSLCs. Downregulation of checkpoint protein 2, a key player of SASP, significantly reduced the emergence of CSLCs. Our results unravel a novel molecular mechanism by which SASP might promote malignancy, underlining the dual role of senescence in tumorigenesis. This mechanism, based on mutual cooperation among tumor cells, illustrates how cancer may relapse; its targeting could represent new therapeutic opportunities.


Figures

Figure 1
Figure 1
Genotoxic stress induces the emergence of a cell population that resembles CSCs. (a) Flow cytometry analysis of RPMI 8226 cells 7 days after X-irradiation (0–6 Gy) and 2 days after doxorubicin treatment (0–50 nM) are presented on the left (P=0.014) and on the right (P=0.0011), respectively. (b) QRT-PCR analysis of BCL6 and PAX5 gene expressions of CD138-sorted RPMI 8226 cells and RPMI 8226 cells 7 days after X-irradiation (6 Gy) and 2 days after doxorubicin treatment (50 nM); the untreated main population served as reference. (c) RPMI 8226 cells were seeded in methylcellulose 7 days after X-ray treatment (6 Gy) or control (0 Gy) and the number of colonies was quantified after the first, second and third replating. (d) At 7 days after X-ray treatment, 104 irradiated (6 Gy) or control (0 Gy) RPMI 8226 cells were injected subcutaneously into five nude mice per series. The graphic illustrates the number of mice bearing tumors 12 weeks post-injection. Tumors were stained with hematoxylin or labeled with anti-CD138 antibody. Images were taken at × 40 magnification. Data are means±S.D. from at least three independent experiments; *P<0.05; a.u., arbitrary unit
Figure 2
Figure 2
Emergence of CSLCs is, in part, due to their intrinsic properties. (a) Cell cycle distribution of CD138low and CD138high RPMI 8226 cells 2 days after a 6 Gy dose of X-irradiation is illustrated on the left and the percentage of cells in G0/G1 after flow cytometry analysis on the right. (b) Intracellular ROS were detected by DCFDA staining in CD138low (dark gray) and CD138high (light gray) cells. Percentage of DCFDA-positive cells is represented on the graph (P=0.00088). (c) Irradiated (6 Gy) and control cells (0 Gy) were double-stained for CD138 and γH2AX 30 min after X-irradiation, and quantitatively analyzed by flow cytometry. (d) Percentage of mortality is plotted against the percentage of CD138low/CD45high/CD20high cells (R2=0.1358). White and black squares represent data from cells subjected to X-irradiation (6 Gy, 7 days post X-irradiation) and doxorubicin treatment (2 days post-treatment at 2.7, 13.5 and 50 nM), respectively. Data are means±S.D. from at least three independent experiments, except for (d) where squares represent the mean of two independent experiments; **P<0.001
Figure 3
Figure 3
Emergence of CSLCs correlates with an SASP induced by genotoxic stress. (a) RPMI 8226 were X-irradiated with a dose of 6 Gy, stained by β-galactosidase 7 days post-treatment and quantified. For each experiment, several fields were counted. Data are means±S.D. for 50 cells counted over two independent experiments (left panel). RPMI 8226 cells were treated with doxorubicin (50 nM) and stained with β-galactosidase 2 days post-treatment. Senescent cells were stained with C12FDG and quantified by flow cytometry 2 days post-treatment with doxorubicin (2.7, 13.5 and 50 nM) (P=0.00062) (right panel). (b) Percentage of senescent cells is plotted against the percentage of CD138low/CD45high/CD20high cells (R2=0.8288). White and black circles represent data from cells subjected to X-irradiation (6 Gy, 7 days post X-irradiation) and doxorubicin treatment (2 days post-treatment at 5, 25 and 50 nM), respectively. (c) Whole-cell lysates were prepared 7 days after X-irradiation with a dose of 6 Gy (left panel) or 2 days after a treatment with 50 nM doxorubicin (right panel) and analyzed by western blot with anti-γH2AX, -CHK2, -pCHK2 (Thr68) and -GAPDH (as control) antibodies. Similar results were obtained in two independent experiments. (d) A cytokine array was used to identify the cytokines and/or chemokines released into the medium by cells treated with 50 nM doxorubicin (conditioned medium). The medium of untreated cells was used as control (control medium). (e) QRT-PCR analysis of IP-10 and RANTES expressions in RPMI 8226 2 days after doxorubicin treatment (50 nM); the untreated main population served as reference. Data are means±S.D. from at least three independent experiments, except for (b) where circles represent the mean of two independent experiments; **P<0.001
Figure 4
Figure 4
The SASP of non-CSLCs is essential for CSLCs. (a) RPMI 8226 cells treated with doxorubicin (2.7, 13.5 and 50 nM) for 2 days were double-stained with CD138 and C12FDG as illustrated in the top panel for 0 and 50 nM doxorubicin. CD138low and CD138high senescent cells were quantified by flow cytometry. (b) QRT-PCR analysis of IP-10 and RANTES expressions in CD138low- and CD138high-sorted RPMI 8226 cells 2 days after doxorubicin treatment (50 nM); the untreated CD138low- and CD138high-sorted RPMI 8226 cells served as reference (P=0.12 and P=0.0031 for IP-10 and RANTES, respectively). (c) CD138low-sorted RPMI 8226 cells were cultured either in the control medium (medium of untreated cells) or in the conditioned medium (medium of cells treated with 50 nM doxorubicin for 2 days). Cells were stained with CD138 after 1 day of culture and analyzed by flow cytometry (P=0.02). (d) RPMI 8226 cells having migrated overnight towards the control medium or the conditioned medium were analyzed by flow cytometry after CD138 labeling (P=0.0047 and P=0.0045 for CD138low and CD138high, respectively). (e) RPMI 8226 cells were infected with lentiviral particles containing shRNA-targeting CHK2 or control shRNA. Whole-cell lysates were prepared and analyzed by western blot with anti-CHK2 antibody to confirm the downregulation of CHK2. Cells were treated (or not for controls) with doxorubicin (50 nM) for 2 days and CD138low/CD45high/CD20high cells were tracked and quantified as described previously (P=0.049). Data are means±S.D. from at least three independent experiments; *P<0.5

References

    1. Clarke MF, Dick JE, Dirks PB, Eaves CJ, Jamieson CH, Jones DL, et al. Cancer stem cells – perspectives on current status and future directions: AACR Workshop on cancer stem cells. Cancer Res. 2006;66:9339–9344. - PubMed
    1. Bleau AM, Hambardzumyan D, Ozawa T, Fomchenko EI, Huse JT, Brennan CW, et al. PTEN/PI3K/Akt pathway regulates the side population phenotype and ABCG2 activity in glioma tumor stem-like cells. Cell Stem Cell. 2009;4:226–235. - PMC - PubMed
    1. Achuthan S, Santhoshkumar TR, Prabhakar J, Nair SA, Pillai MR. Drug-induced senescence generates chemoresistant stemlike cells with low reactive oxygen species. J Biol Chem. 2011;286:37813–37829. - PMC - PubMed
    1. Bao S, Wu Q, McLendon RE, Hao Y, Shi Q, Hjelmeland AB, et al. Glioma stem cells promote radioresistance by preferential activation of the DNA damage response. Nature. 2006;444:756–760. - PubMed
    1. Diehn M, Cho RW, Lobo NA, Kalisky T, Dorie MJ, Kulp AN, et al. Association of reactive oxygen species levels and radioresistance in cancer stem cells. Nature. 2009;458:780–783. - PMC - PubMed

Publication types

MeSH terms