. 2013 Mar;57(3):1180-91.
doi: 10.1128/AAC.02053-12. Epub 2012 Dec 17.

Lucidone suppresses hepatitis C virus replication by Nrf2-mediated heme oxygenase-1 induction

Affiliations

Lucidone suppresses hepatitis C virus replication by Nrf2-mediated heme oxygenase-1 induction

Wei-Chun Chen et al. Antimicrob Agents Chemother. 2013 Mar.

Abstract

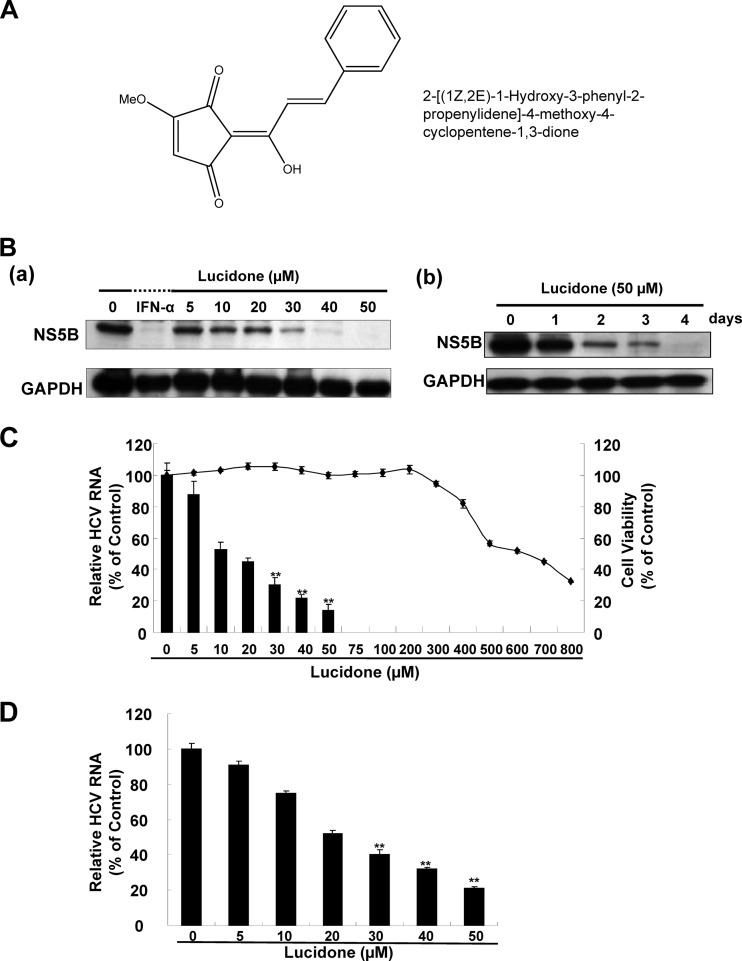
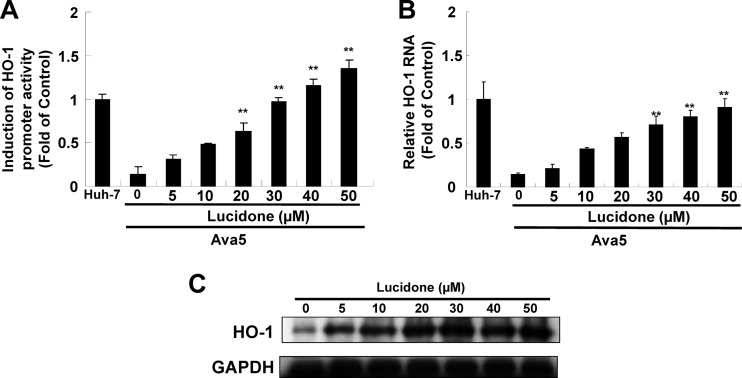
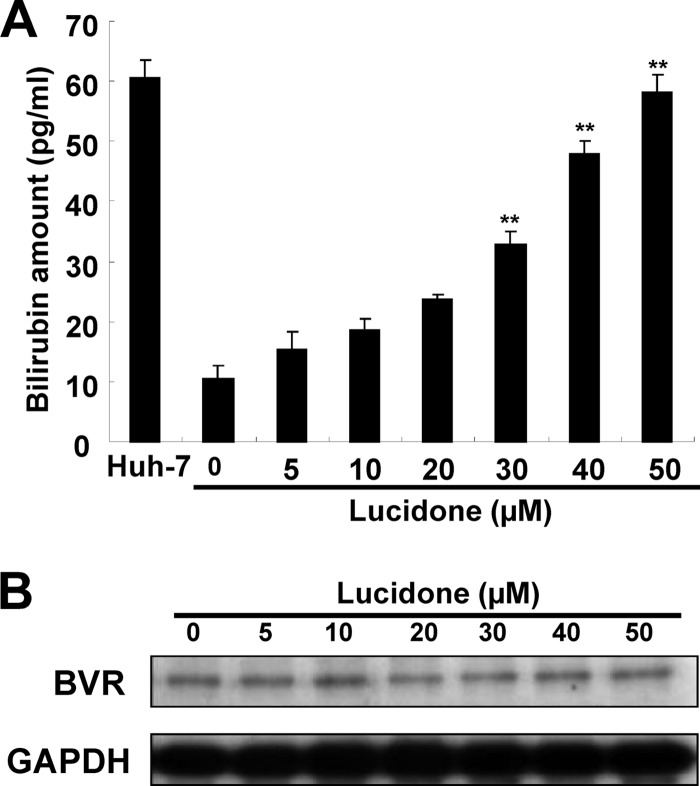
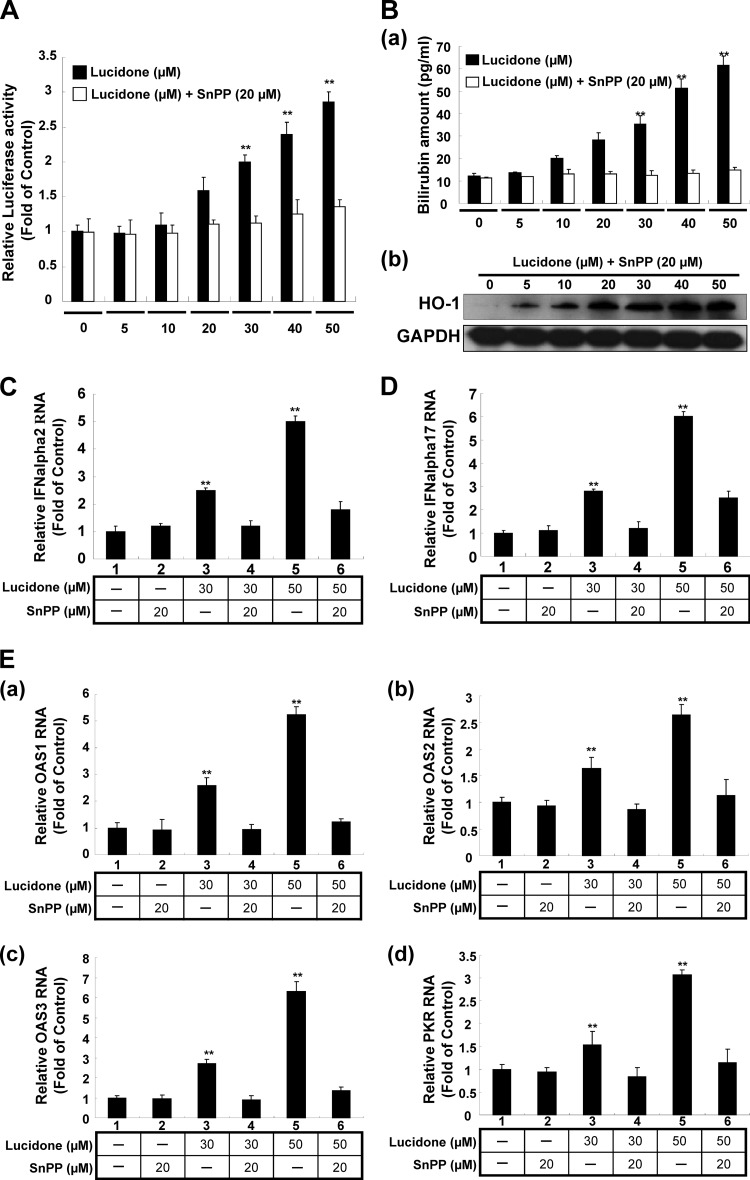
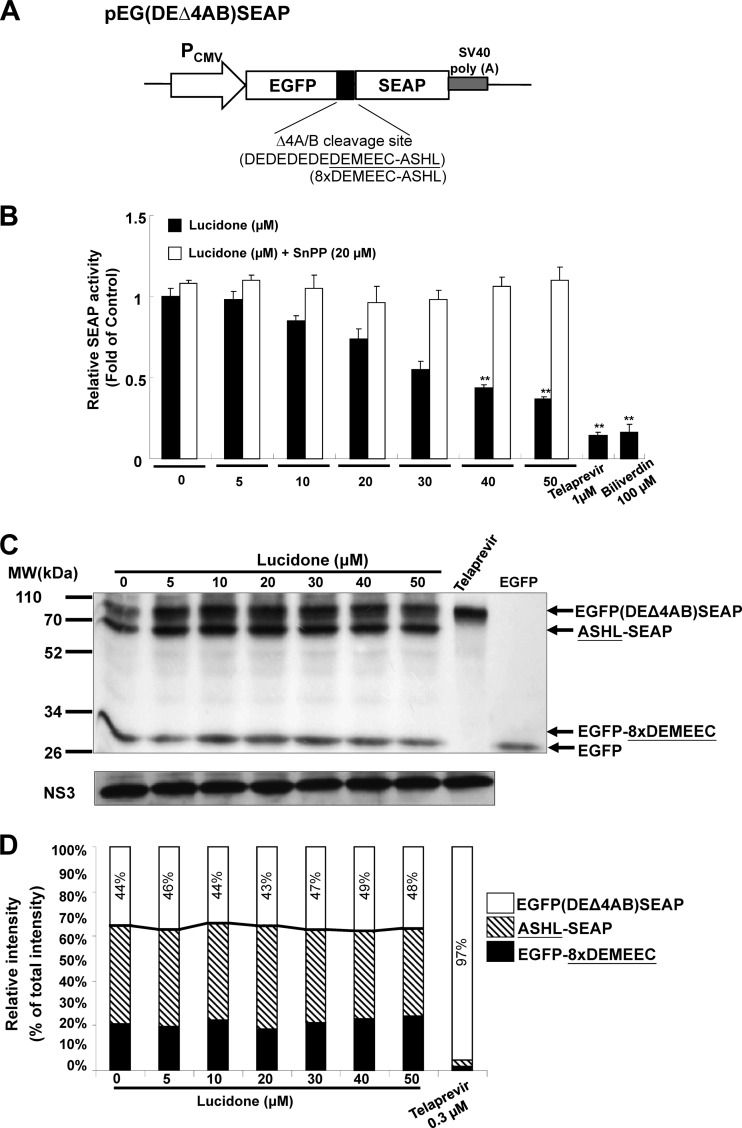
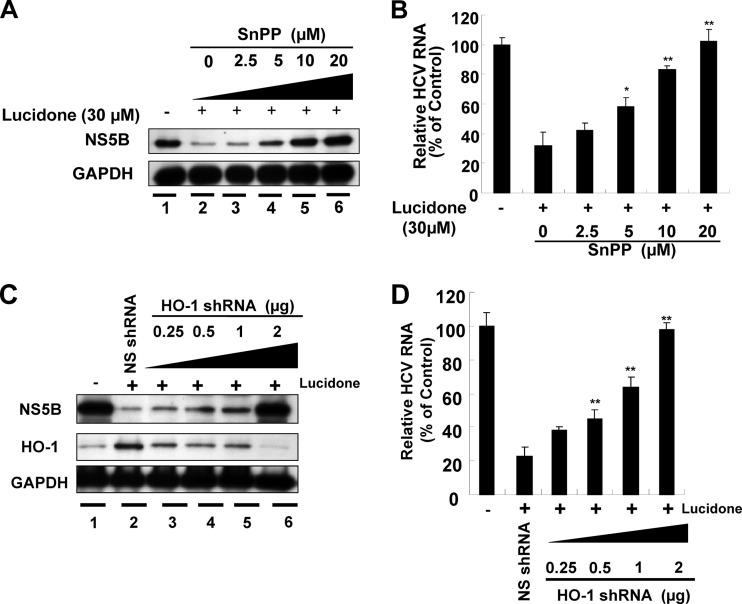
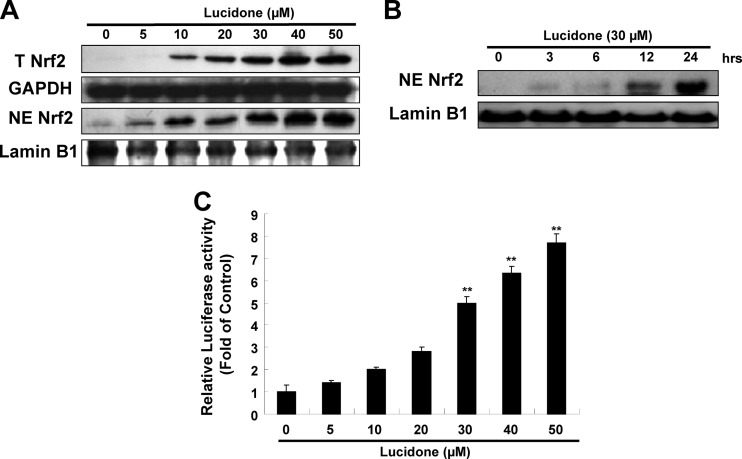
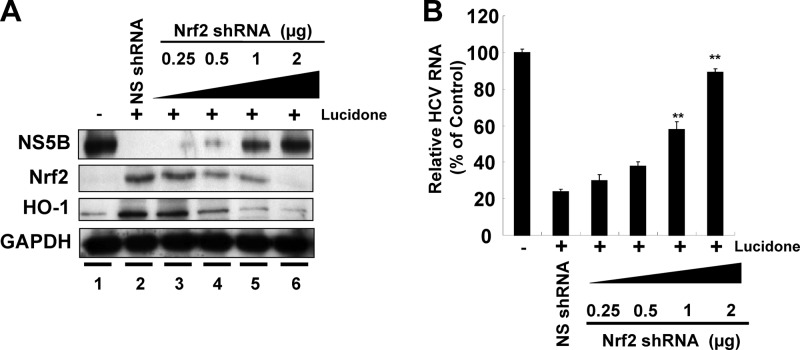
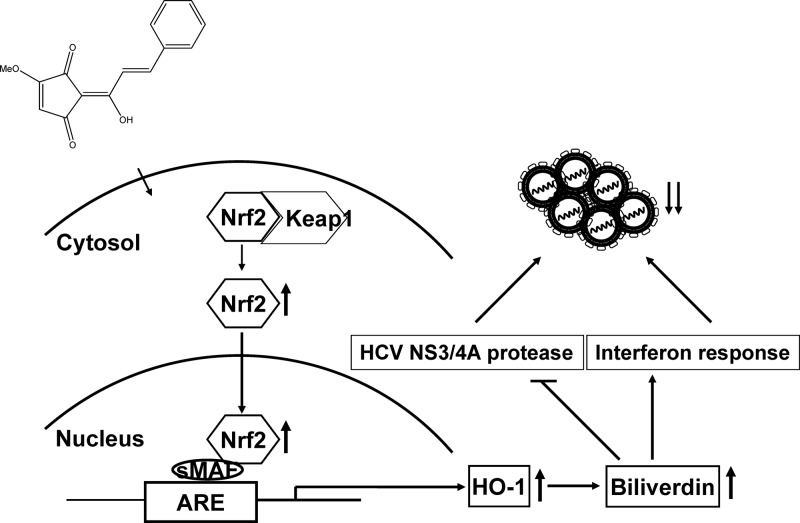
Upon screening of plant-derived natural products against hepatitis C virus (HCV) in the replicon system, we demonstrate that lucidone, a phytocompound, isolated from the fruits of Lindera erythrocarpa Makino, significantly suppressed HCV RNA levels with 50% effective concentrations of 15 ± 0.5 μM and 20 ± 1.1 μM in HCV replicon and JFH-1 infectious assays, respectively. There was no significant cytotoxicity observed at high concentrations, with a 50% cytotoxic concentration of 620 ± 5 μM. In addition, lucidone significantly induced heme oxygenase-1 (HO-1) production and led to the increase of its product biliverdin for inducing antiviral interferon response and inhibiting HCV NS3/4A protease activity. Conversely, the anti-HCV activity of lucidone was abrogated by blocking HO-1 activity or silencing gene expression of HO-1 or NF-E2-related factor 2 (Nrf2) in the presence of lucidone, indicating that the anti-HCV action of lucidone was due to the stimulation of Nrf-2-mediated HO-1 expression. Moreover, the combination of lucidone and alpha interferon, the protease inhibitor telaprevir, the NS5A inhibitor BMS-790052, or the NS5B polymerase inhibitor PSI-7977, synergistically suppressed HCV RNA replication. These findings suggest that lucidone could be a potential lead or supplement for the development of new anti-HCV agent in the future.


Figures

Fig 1
Fig 1
Effect of lucidone on HCV protein expression and RNA replication. (A) Structure of lucidone. The molecular formula is C15H12O4. (B) Inhibitory effects of lucidone on HCV protein synthesis in concentration (a)- and time (b)-dependent analyses. Ava5 cells were exposed to different concentrations (0, 5, 10, 20, 30, 40, and 50 μM) of lucidone for 4 days or different lengths of time (1 to 4 days) at concentrations of 50 μM. Treatment with 100 U of IFN-α/ml served as a positive control. Western blotting was performed with anti-HCV NS5B and anti-GAPDH antibodies. GAPDH (glyceraldehyde-3-phosphate dehydrogenase) protein levels confirmed equal loading of cell lysates. (C and D) Inhibitory effects of various concentrations of lucidone on HCV RNA replication in HCV replicon (C) and HCV JFH-1 (D) infectious systems. The total RNA of lucidone-treated Ava5 cells or JFH-1-infected Huh-7 cells was extracted to quantify HCV RNA levels by qRT-PCR. The relative HCV RNA levels were normalized by cellular gapdh mRNA expression. Cellular toxicity was evaluated by the MTS assay. The results are expressed as means of normalized data ± the SD for triplicate experiments. The error bars denote the SD of the mean. *, P < 0.05; **, P < 0.01.
Fig 2
Fig 2
Effect of lucidone on HO-1 expression. (A to C) Concentration-dependent induction of HO-1 promoter activity (A), RNA transcription (B), and protein synthesis by lucidone (C). For the promoter activity assay, Ava5 cells were transiently transfected with 1 μg of the HO-1 promoter reporter vector pHO-1-Luc. Subsequently, the transfected cells were treated with the indicated concentrations (0 to 50 μM) of lucidone for 3 days, and the total cell lysates were analyzed for luciferase activity. The pHO-1-Luc-transfected-Huh-7 cells provided the basal level of HO-1 promoter activity, which was defined as 1. For RNA and protein analysis, Ava5 cells were incubated with the indicated concentrations (0 to 50 μM) of lucidone for 3 days. The total RNA of Huh-7 cells and lucidone-treated Ava5 cells was extracted to quantify HO-1 mRNA levels by qRT-PCR. The HO-1 mRNA levels in Huh-7 cells was defined as 1. Total cell lysates were extracted and analyzed by Western blotting with anti-HO-1 and anti-GAPDH (loading control) antibodies. The results are expressed as the mean fold values of normalized data ± the SD for triplicate experiments. The error bars denote the SD of the mean fold values.*, P < 0.05; **, P < 0.01.
Fig 3
Fig 3
Effect of lucidone on bilirubin production and biliverdin reductase (BVR) protein expression. (A) Concentration-dependent production of bilirubin by lucidone. Ava5 cells were incubated with the indicated concentrations (0 to 50 μM) of lucidone for 3 days, and the total cell lysates were harvested for quantification of bilirubin concentration using a MeDiPro direct bilirubin test kit and CFAS (calibrator for automated systems). Parental Huh-7 cells provided the basal amount of bilirubin. (B) No significant difference in BVR protein expression in the presence of lucidone. Ava5 cells were exposed to different concentrations (0 to 50 μM) of lucidone for 3 days, and total cell lysates were subjected to Western blotting using anti-BVR and anti-GAPDH antibodies. GAPDH protein levels confirmed equal loading of cell lysates. The results are expressed as the mean values ± the SD for triplicate experiments. The error bars denote SD of the mean. *, P < 0.05; **, P < 0.01.
Fig 4
Fig 4
Induction of the antiviral IFN responses by lucidone in HCV replicon cells. (A) Concentration-dependent induction of ISRE activity by lucidone. (B) Restoration of lucidone-induced HO-1 activity by HO-1 inhibitor SnPP. (C to E) Concentration-dependent induction of gene expression of IFN-α2 (C) and IFN-α17 (D) and IFN-mediated gene expression (E, panels a to d) by lucidone. For reporter analysis, Ava5 cells were transiently transfected with 1 μg of the IFN response reporter vector pISRE-Luc. Subsequently, the pISRE-Luc-transfected cells were incubated with the indicated concentrations (0 to 50 μM) of lucidone with or without 20 μM HO-1 inhibitor SnPP for 3 days, and total cell lysates were analyzed for luciferase activity. Luciferase activity in lucidone-untreated cells was defined as 1. For the detection of bilirubin production and HO-1 expression, the total cell lysates of lucidone-treated Ava5 cells were harvested for the quantification of bilirubin concentration and Western blot analysis using the MeDiPro direct bilirubin test kit combined with CFAS (calibrator for automated systems) and anti-HO-1 antibody, respectively, under the same assay conditions. GAPDH protein levels confirmed equal loading of cell lysates. For gene expression analysis, the total RNA of lucidone-treated Ava5 cells was extracted to quantify the RNA levels of IFN-α2, IFN-α17, OAS1, OAS2, OAS3, and PKR by qRT-PCR analysis under the same assay conditions. The relative RNA levels were normalized by cellular gapdh mRNA expression. The RNA level in lucidone-untreated Ava5 cells was defined as 1. Each value represents the mean fold of normalized data ± the SD for triplicate experiments. The error bars denote the SD of the mean. *, P < 0.05; **, P < 0.01.
Fig 5
Fig 5
Effect of lucidone on the HCV NS3/4A protease activity. (A) Schematic representation of the NS3 response reporter vector pEG(DEΔ4AB)SEAP. The decapeptide sequence, named 8×DEMEEC-ASHL, corresponding to the NS4A/B junction was inserted between egfp and seap. (B) Concentration-dependent reduction of NS3/4A protease activity by lucidone in cell-based analysis. Huh-7 cells were transiently cotransfected with 1 μg of the pEG(DEΔ4AB)SEAP vector and 0.5 μg of the NS3/4A expression vector pNS3/4A. Subsequently, the transfected cells were treated with the indicated concentrations (0 to 50 μM) of lucidone with or without 20 μM SnPP. After 3 days, total cell lysates were analyzed for SEAP activity. Treatment with 1 μM telaprevir or 100 μM biliverdin served as the positive controls. (C) No significant inhibition of NS3/4A protease activity by lucidone in cell-free TnT analysis. The reaction mixtures contained non-radioisotope-labeled NS3/4A protein and 35S-labeled EG(DEΔ4AB)SEAP substrate protein generated by a cell-free TnT system (Promega) in the absence or presence of increasing concentrations of lucidone. Treatment with 0.3 μM telaprevir severed as a positive control. TnT product of EGFP alone served as an indictor of protease-mediated proteolytic product from EG(DEΔ4AB)SEAP. After incubation for 15 min at 30°C, reactants were subjected to SDS-PAGE and autoradiography. Western blotting with anti-NS3 antibody was performed to reveal equal amounts of NS3/4A protein in each reaction. (D) Densitometric quantification was performed to present the relative cleavage of EG(DEΔ4AB)SEAP in the absence or presence of lucidone. The arrowheads indicated the expected sizes of EG(DEΔ4AB)SEAP, ASHL-SEAP, EGFP-8×DEMEEC, and EGFP. The relative intensity of EG(DEΔ4AB)SEAP was determined as the ratio of EG(DEΔ4AB)SEAP band to total predominant bands corresponding to the TnT products, expressed as the remaining percentage. Each value represents the mean fold ± the SD of triplicate experiments after normalization of luciferase activities. The error bars denote the SD of the mean. *, P < 0.05; **, P < 0.01.
Fig 6
Fig 6
Restoration of lucidone-suppressed HCV protein synthesis and RNA replication by HO-1 inhibition. Ava5 cells were treated with or without different concentrations (0 to 20 μM) of the HO-1 specific inhibitor SnPP in the presence of 30 μM lucidone. After 3 days, HCV protein synthesis (A) and RNA replication (B) were analyzed by Western blotting and qRT-PCR, respectively. Ava5 cells were transfected with either different amounts (0.25 to 2 μg) of the HO-1-specific shRNA or 2 μg of nonspecific EGFP shRNA vectors. After incubation for 12 h, cells were refreshed with complete medium with or without 30 μM lucidone for an additional 3 days. Protein synthesis (C) and HCV RNA replication (D) were analyzed by Western blotting and qRT-PCR, respectively. Each value represents the mean ± the SD of triplicate experiments. The error bars denote SD of the mean. *P < 0.05; ** P < 0.01.
Fig 7
Fig 7
Effects of lucidone on Nrf2 expression in HCV replicon cells. (A) Concentration-dependent induction of Nrf2 expression by lucidone. Ava5 cells were incubated with the indicated concentrations (0 to 50 μM) of lucidone for 3 days. The cytoplasmic and nuclear fractions were separated from the cell lysate and analyzed by Western blotting with anti-Nrf2, anti-lamin B, and anti-GAPDH (loading control) antibodies. (B) Time-dependent nuclear translocation of Nrf2. Ava5 cells were incubated with 30 μM lucidone. The nuclear fractions were extracted, and Western blotting was performed at the indicated time points. (C) Concentration-dependent induction of Nrf2-mediated ARE transactivation. Ava5 cells were transfected with the reporter plasmid p3xARE-Luc and incubated with various concentrations of lucidone (0 to 50 μM). After 3 days, total cell lysates were harvested for the luciferase activity assay. Luciferase activity in lucidone-untreated cells was defined as 1. Each value represents the mean fold ± the SD of triplicate experiments after normalization of SEAP activities. The error bars denote the SD of the mean fold values. *, P < 0.05; **, P < 0.01.
Fig 8
Fig 8
Restoration of lucidone-suppressed HCV protein synthesis (A) and RNA replication (B) by Nrf2 gene silencing. Ava5 cells were transfected with either different amounts (0.25 to 2 μg) of the Nrf2-specific shRNA or 2 μg of nonspecific EGFP shRNA vectors. After incubation for 12 h, the cells were refreshed with complete medium with or without 30 μM lucidone for an additional 3 days. Each protein synthesis and HCV RNA replication were analyzed by Western blotting and qRT-PCR, respectively. Each value represents the mean ± the SD of triplicate experiments. The error bars denote the SD of the mean. *, P < 0.05; **, P < 0.01.
Fig 9
Fig 9
Model for the inhibitory action of lucidone on HCV replication.

Similar articles

Cited by

References

    1. Jahan S, Ashfaq UA, Qasim M, Khaliq S, Saleem MJ, Afzal N. 2012. Hepatitis C virus to hepatocellular carcinoma. Infect. Agents Cancer 7:2. - PMC - PubMed
    1. Giannini C, Brechot C. 2003. Hepatitis C virus biology. Cell Death Differ. 10(Suppl 1):S27–S38 - PubMed
    1. Hayashi N, Takehara T. 2006. Antiviral therapy for chronic hepatitis C: past, present, and future. J. Gastroenterol. 41:17–27 - PubMed
    1. Schaefer M, Mauss S. 2008. Hepatitis C treatment in patients with drug addiction: clinical management of interferon-alpha-associated psychiatric side effects. Curr. Drug Abuse Rev. 1:177–187 - PubMed
    1. Susser S, Welsch C, Wang Y, Zettler M, Domingues FS, Karey U, Hughes E, Ralston R, Tong X, Herrmann E, Zeuzem S, Sarrazin C. 2009. Characterization of resistance to the protease inhibitor boceprevir in hepatitis C virus-infected patients. Hepatology 50:1709–1718 - PubMed

Publication types

MeSH terms

LinkOut - more resources