. 2013 Jan 31;493(7434):632-7.
doi: 10.1038/nature11800. Epub 2012 Dec 19.

Nuclear genome transfer in human oocytes eliminates mitochondrial DNA variants

Affiliations

Nuclear genome transfer in human oocytes eliminates mitochondrial DNA variants

Daniel Paull et al. Nature. .

Abstract

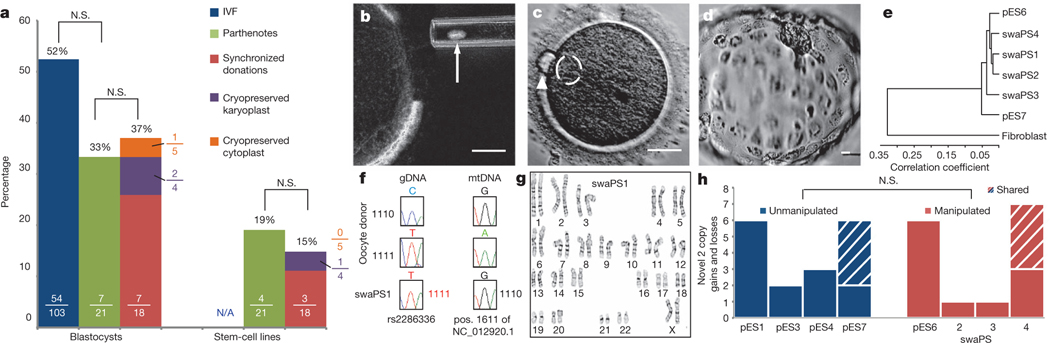
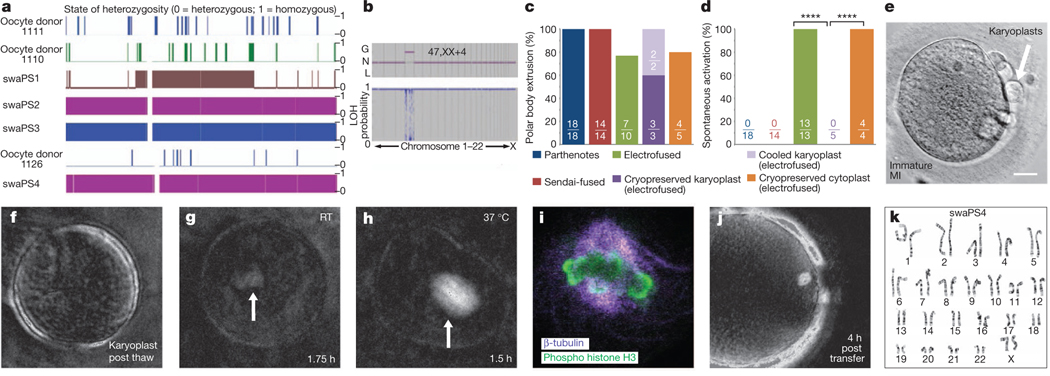
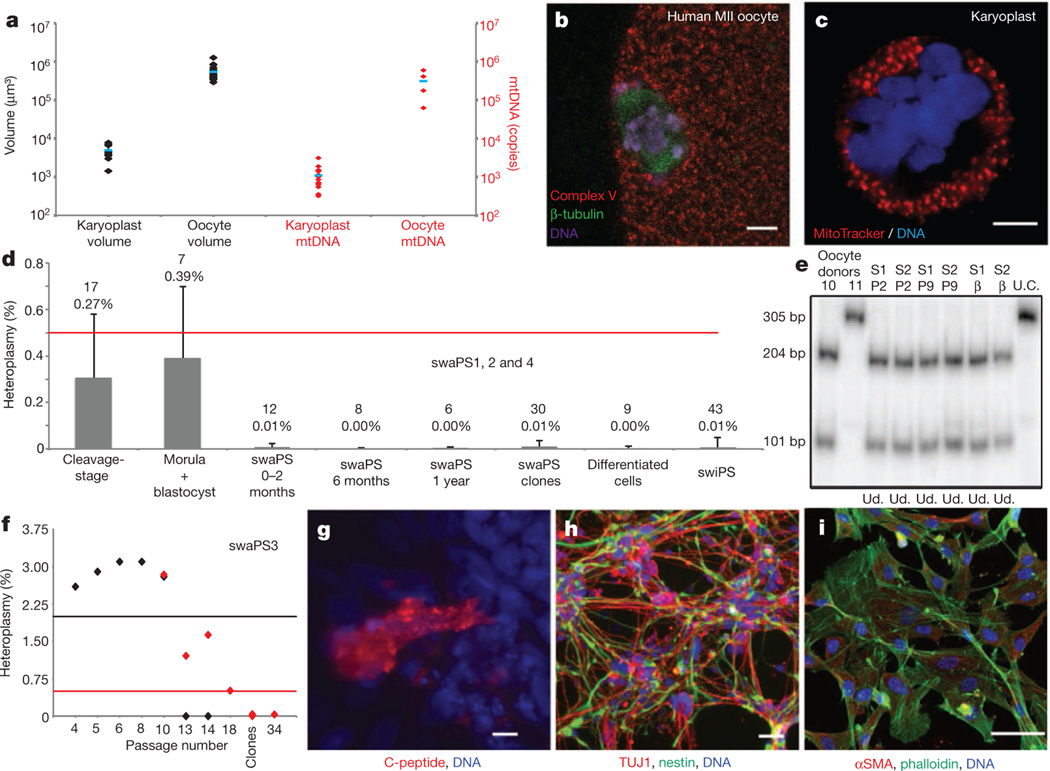
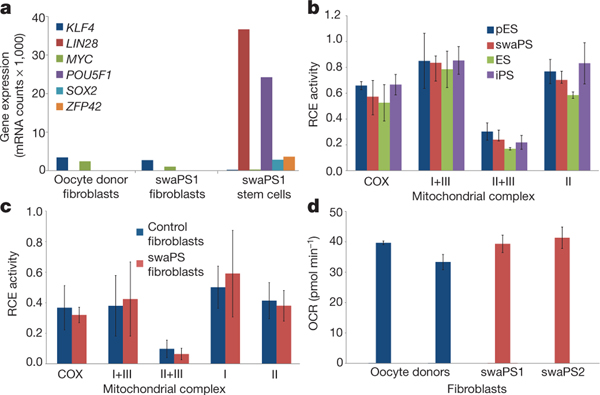
Mitochondrial DNA mutations transmitted maternally within the oocyte cytoplasm often cause life-threatening disorders. Here we explore the use of nuclear genome transfer between unfertilized oocytes of two donors to prevent the transmission of mitochondrial mutations. Nuclear genome transfer did not reduce developmental efficiency to the blastocyst stage, and genome integrity was maintained provided that spontaneous oocyte activation was avoided through the transfer of incompletely assembled spindle-chromosome complexes. Mitochondrial DNA transferred with the nuclear genome was initially detected at levels below 1%, decreasing in blastocysts and stem-cell lines to undetectable levels, and remained undetectable after passaging for more than one year, clonal expansion, differentiation into neurons, cardiomyocytes or β-cells, and after cellular reprogramming. Stem cells and differentiated cells had mitochondrial respiratory chain enzyme activities and oxygen consumption rates indistinguishable from controls. These results demonstrate the potential of nuclear genome transfer to prevent the transmission of mitochondrial disorders in humans.


Figures

Figure 1 |
Figure 1 |. Efficient development and genomic integrity after nuclear genome exchange.
a, Developmental potential of IVF embryos, parthenogenic and genome-exchanged oocytes. Numbers in each bar displays the proportions of oocytes developing to the indicated stage. b, Removal of the karyoplast (indicated by arrow). c. Polar body extrusion (arrowhead) and pronuclear formation (dashed circle) at 4 h after activation d, Blastocyst stage at day 7 after activation. e, Cluster diagram of global gene expression profiles of swaPS cell lines. f, Sanger sequences of genomic DNA (gDNA) and mtDNA. g, Karyotype of swaPS1 cells at P3. h, Copy number variation analysis. N.S., not significant. Scale bars, 25 μm for all panels.
Figure 2 |
Figure 2 |. Spontaneous activation can be prevented through spindle cooling.
a, Affymetrix SNP microarray (chromosome 7). b, Array analysis at the cleavage stage, revealing trisomy on chromosome 4. G, gain; L, loss; LOH, loss of heterozygosity; N, normal. c, Frequency of polar body extrusion. d, Frequency of manipulation-induced activation. ****P < 0.0001. e, Karyoplasts after cryopreservation. Scale bar, 25 mm. f–h, Spindle birefringence at indicated temperatures and time points post thaw. Arrows indicate site of spindle. RT, room temperature. i, Confocal analysis of a thawed karyoplast after 2 h at room temperature. j, Spindle birefringence after transfer of a thawed karyoplast into an enucleated oocyte. k, Karyotype of stem-cell line derived from a cryopreserved karyoplast, swaPS4, at P4.
Figure 3 |
Figure 3 |. Low levels of mtDNA carryover.
a, Volume (black) and mtDNA copies (red) of karyoplasts and oocytes. Blue barsdenote themean. b, c, Distribution of mitochondria in the oocyte (b) and the karyoplast (c). d, Mean heteroplasmy quantification by ARMS-qPCR. Red line indicates limit of detection. Error bars indicate s.d., with the mean value and n number shown. e, RFLP analysis of swaPS1 and swaPS2 (S1 and S2, respectively) at P2 and P9 and as β-cells. bp, base pairs; U.C., undigested control; Ud., undetectable. f, Heteroplasmy in swaPS3 cells. ARMS-qPCR (red diamonds) and RFLP (black diamonds); black and red lines indicate detection limits. gi, Directed differentiation into β-cells (g), neurons (h) and fibroblasts (i). αSMA, α-smooth muscle actin. Scale bars, 5 μm (b, c) and 50 μm (gi).
Figure 4 |
Figure 4 |. swaPS cells support a normal metabolic profile.
a, Nanostring gene expression analysis of fibroblasts derived from swaPS1 cells. mRNA counts per 100 ng RNA. b, Respiratory chain enzyme (RCE) activities in ES, pES, swaPS and iPS cell lines derived from oocyte donor skin cells. COX, cytochrome c oxidase (also known as complex IV). c, RCE activities of mitochondrial respiratory complexes in swaPS1- and swaPS2-derived fibroblasts (swaPS fibroblasts) compared withcontrol fibroblasts. d, Analysis of basal oxygen consumption rate (OCR) in swaPS1- and swaPS2-derived fibroblasts compared with control fibroblasts. Error bars denote s.d.

References

    1. Jenuth JP, Peterson AC, Fu K. & Shoubridge EA Random genetic drift in the female germline explains the rapid segregation of mammalian mitochondrial DNA. Nature Genet. 14, 146–151 (1997). - PubMed
    1. Bolhuis PA et al. Rapid shift in genotype of human mitochondrial DNA in a family with Leber’s hereditary optic neuropathy. Biochem. Biophys. Res. Commun 170, 994–997 (1990). - PubMed
    1. Cree LM et al. A reduction of mitochondrial DNA molecules during embryogenesis explains the rapid segregation of genotypes. Nature Genet. 40, 249–254 (2008). - PubMed
    1. Wai T, Teoli D. & Shoubridge EA The mitochondrial DNA genetic bottleneck results from replication of a subpopulation of genomes. Nature Genet. 40, 1484–1488 (2008). - PubMed
    1. Steffann J. et al. Analysis of mtDNA variant segregation during early human embryonic development: a tool for successful NARP preimplantation diagnosis. J. Med. Genet 43, 244–247 (2006). - PMC - PubMed

Publication types

Substances

Associated data