. 2013 Jan 1;12(1):98-111.
doi: 10.4161/cc.23029. Epub 2012 Dec 19.

Regulation of miR106b cluster through the RB pathway: mechanism and functional targets

Affiliations

Regulation of miR106b cluster through the RB pathway: mechanism and functional targets

Chellappagounder Thangavel et al. Cell Cycle. .

Abstract

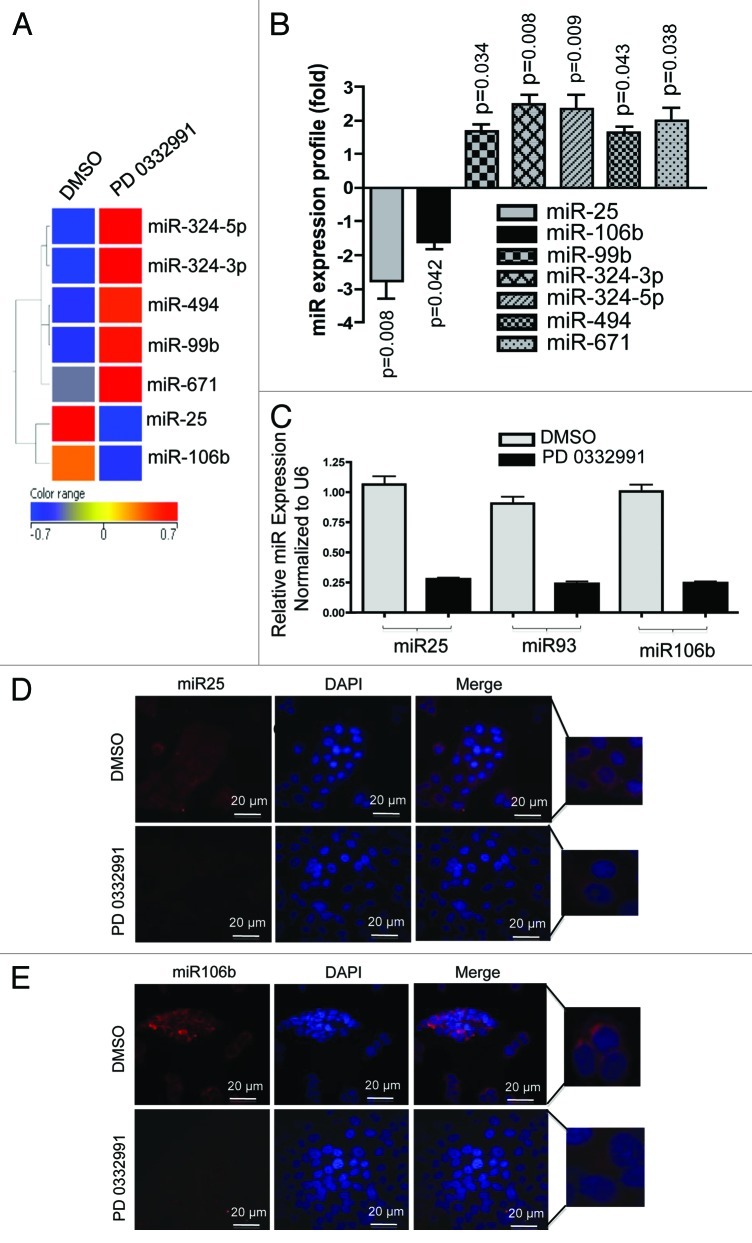
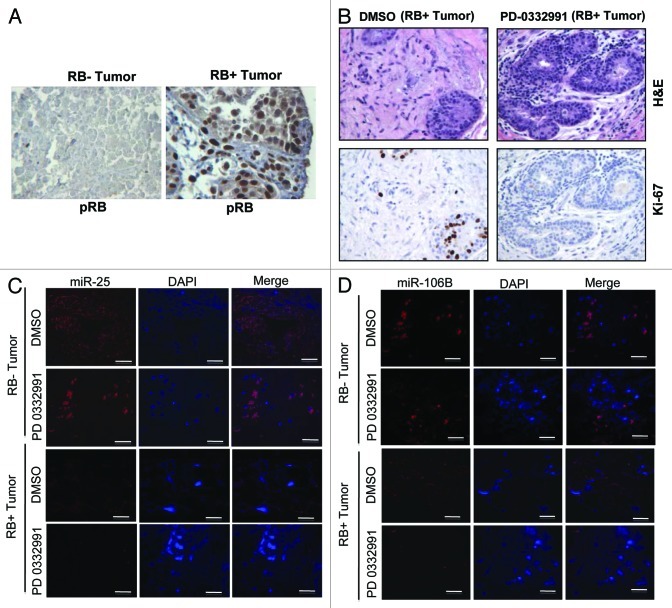
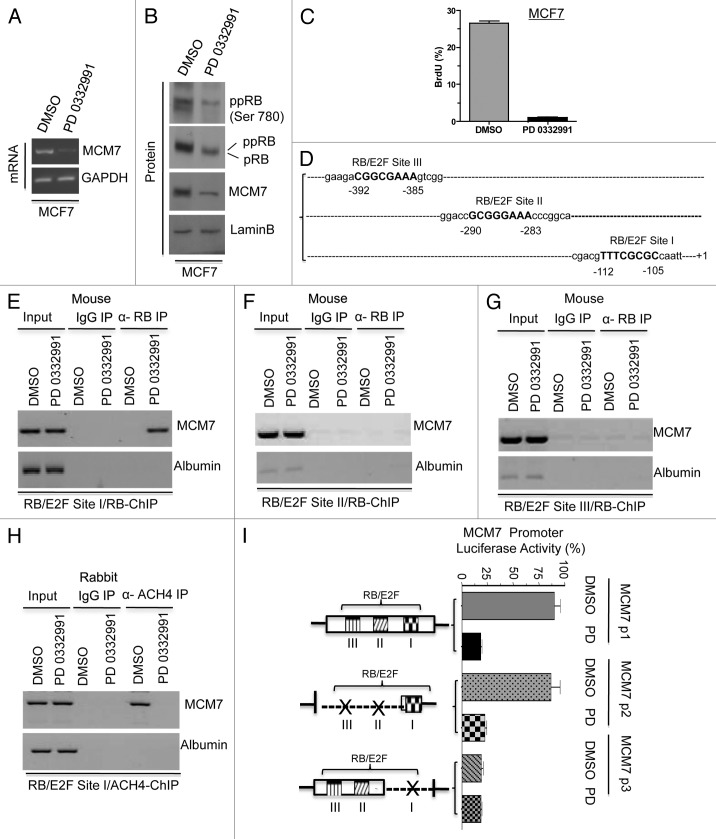
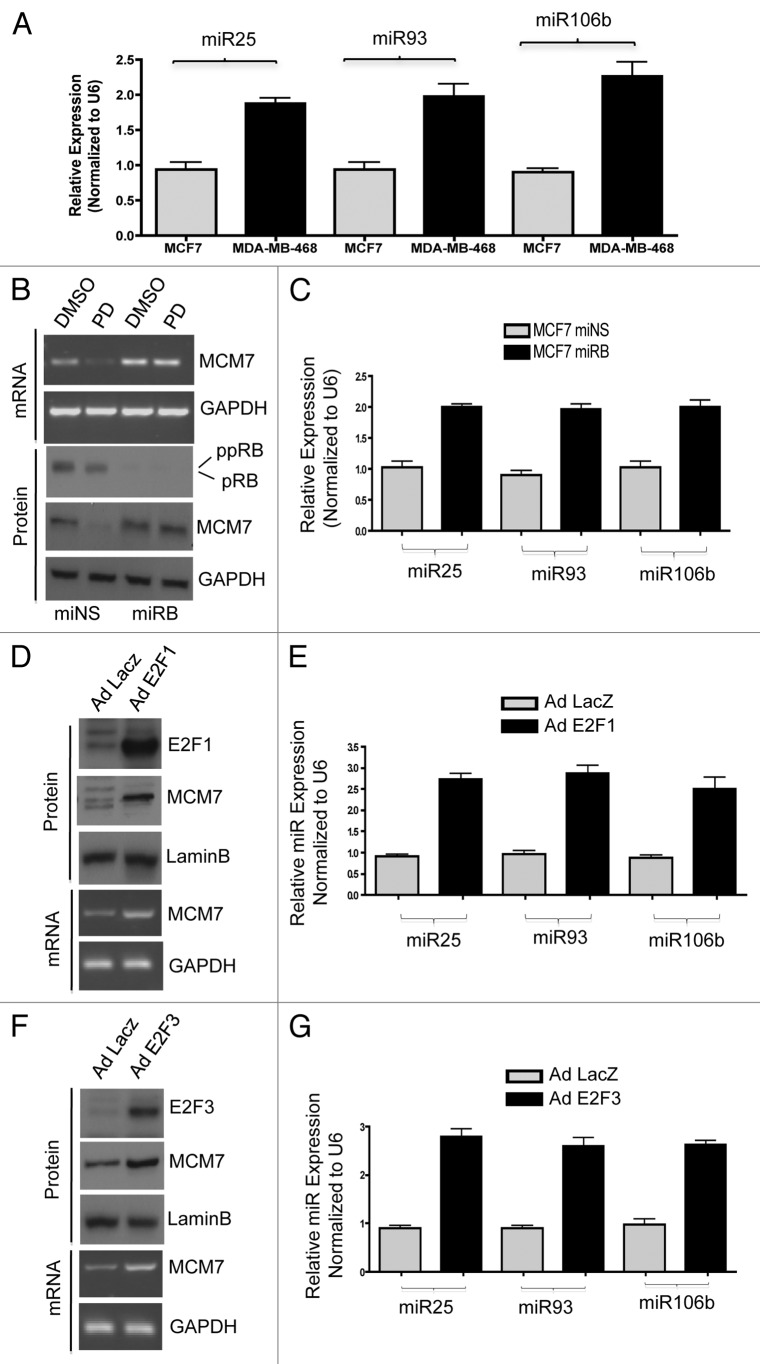
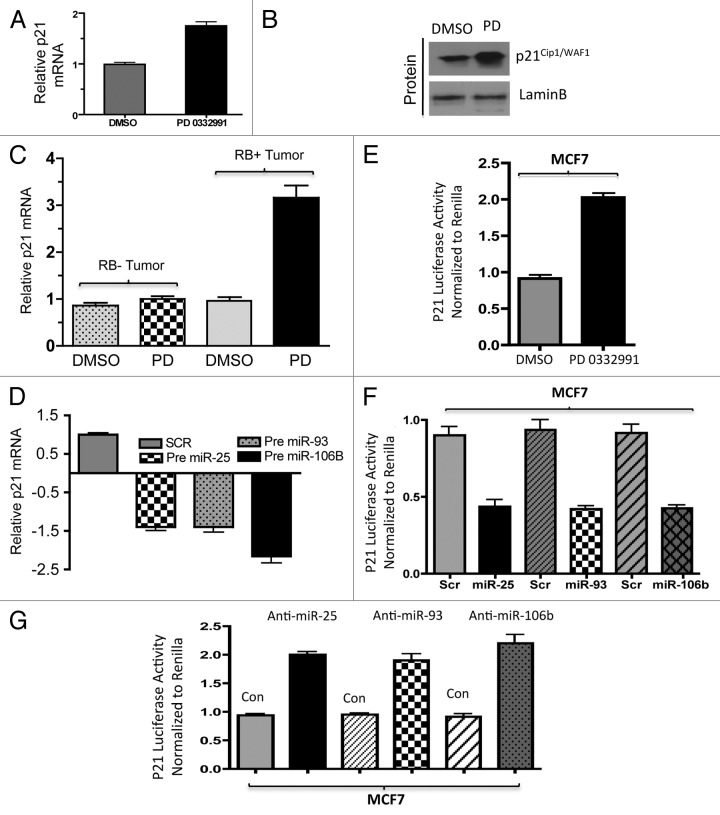
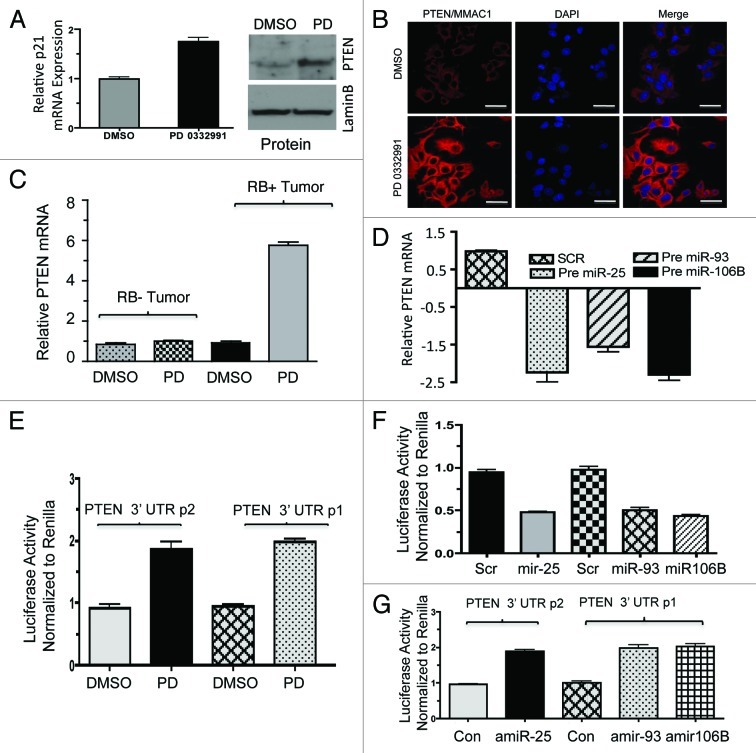
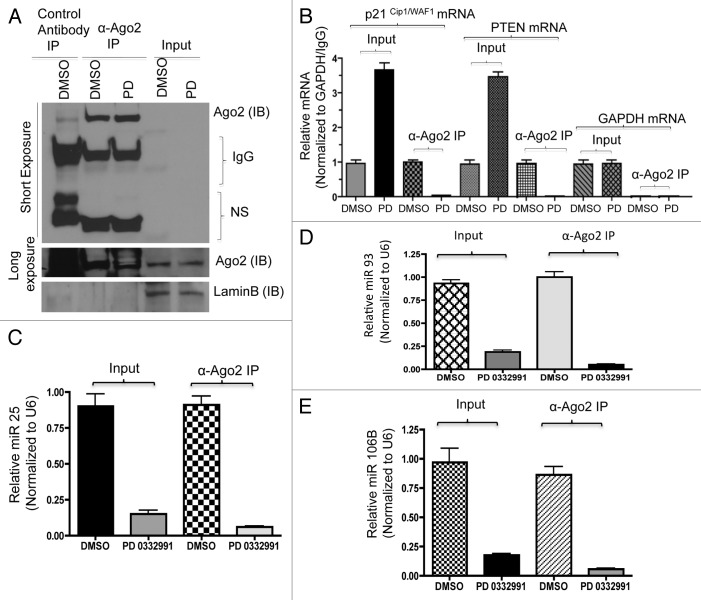
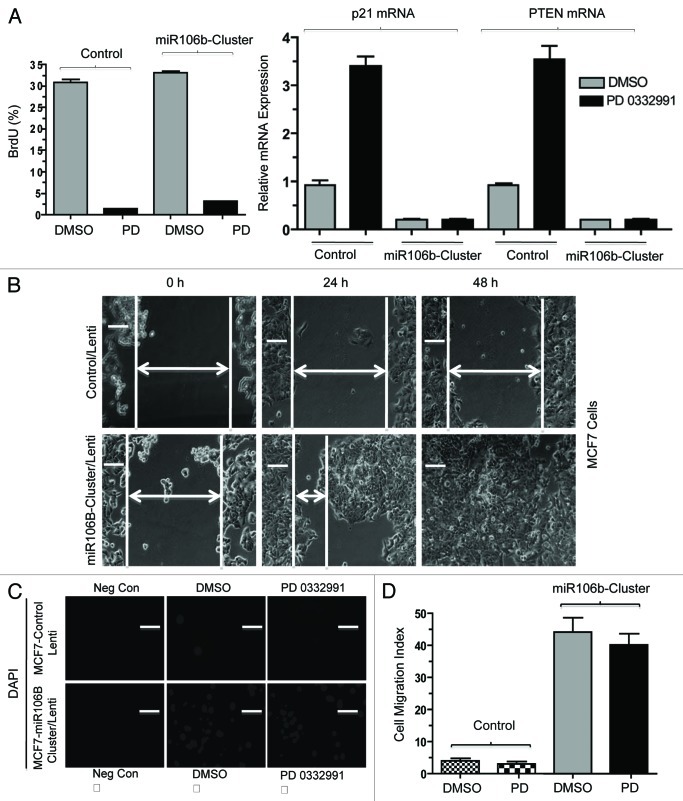
The RB pathway plays a critical role in proliferation control that is commonly subverted in tumor development. However, restoration of RB pathway function can be elicited in many tumor cells by the inhibition of CDK4/6 activity that leads to dephosphorylation of RB and subsequent repression of E2F-mediated transcription. In this context, active RB/E2F complexes inhibit the expression of a critical program of coding genes that promote cell cycle progression. However, the non-coding RNA target genes downstream from RB that could be relevant for tumor biology remain obscure. Here, miRNA gene expression profiling identified the miR106b cluster as being efficiently repressed with CDK4/6 inhibition in an E2F and RB-dependent manner. Importantly, the miR106B-cluster is intragenic of MCM7, and through a series of functional studies, the basis of MCM7 regulation and concordant expression of the miRNA species within the 106b cluster was determined. Importantly, RB-mediated repression of the 106b cluster enhances the transcript levels of p21Cip1 and PTEN. These data provide a mechanistic basis for cross-talk between the RB pathway and p21 and PTEN through the regulation of the MCM7/miR106b locus.


Figures

None
Figure 1. MicroRNA profiling and validation in MCF7 cells in response to CDK4/6 inhibitor. (A) Heat map of differentially regulated microRNAs. (B) Graphic representation of differentially expressed microRNAs in response to DMSO or PD 0332991. (C) qRT-PCR validation of miR 25, 93 and 106b. (D) In situ hybridization detection of miR-25. (E) In situ hybridization detection of miR-106b. Each data point is a mean ± SD from three or more independent experiments. p < 0.05 were considered as significant.
None
Figure 2. MicroRNA 106b-cluster analysis in human breast tumor explants treated with PD 0332991. (A) Immunohistochemical localization of pRB in RB- and RB+ human breast tumors. (B) H&E and ki67 staining in RB+ human solid breast tumors. (C) In situ hybridization detection of miR25 in RB- and RB+ human breast tumors. (D) In situ hybridization detection of miR106b. (n = 11 ER+RB+ tumors and 2 ER-RB- tumors.)
None
Figure 3. Analysis of transcriptional control in MCM7 gene in MCF7 cells in response to CDK4/6 inhibitor. (A) Semi-quantitative RT-PCR analysis of MCM7 and GAPDH mRNA expression. (B) Western blotting analysis of pRB, phospho RB (Ser 780), MCM7 and loading control lamin b. (C) Analysis of BrdU incorporation by flow cytometric analysis. (D) Schematic representation of RB/E2F-biding nucleotide sequences on MCM7 promoter. (E) Identification pRB association on RB/E2F consensus binding site I on MCM7 promoter (ChIP assay). (F) RB ChIP on RB/E2F consensus binding site II of MCM7 promoter in response to DMSO or PD 0332991 in MCF7 cells. (G) RB ChIP on RB/E2F consensus binding site III of MCM7 promoter in response to DMSO or PD 0332991 in MCF7 cells. (H) Identification acetylated histone 4 association on RB/E2F binding site I on MCM7 promoter (ChIP assay). (I) MCM7 promoter analysis (luciferase assay). Each data point is a mean ± SD from three or more independent experiments. p < 0.05 were considered as significant.
None
Figure 4. Comparative analysis of miR106b cluster expression in different breast cancer cell lines in response to PD 0332991 and RB status. (A) qRT-PCR analysis of miR106b cluster in RB-proficient MCF7, RB mutant MDA-MB 468 cells and the signals are normalized to U6 internal control. (B) Semi-quantitative RT-PCR analysis of MCM7 mRNA and loading control GAPDH in miNS and miRB MCF7 cells (top panel) and immunoblot analysis of pRB, MCM7 and loading control lamin b (bottom panel). (C) qRT-PCR analysis of miR106b cluster in miNS and miRB MCF7 cells, and the signals are normalized to U6 internal control. (D) Semi-quantitative RT-PCR analysis of MCM7 and GAPDH mRNA in E2F1-overexpressing MCM7 cells (bottom panel) and immunoblot analysis of MCM7, E2F1 and lamin b in E2F1-overexpressing MCM7 cells (top panel). (E) qRT-PCR analysis of miR106b- cluster in E2F1-overexpressing MCF7 cells and the signals are normalized to U6 internal control. (F) Semi-quantitative RT-PCR analysis of MCM7 and GAPDH mRNA (bottom panel) and immunoblot analysis of MCM7, E2F3 and lamin b in E2F3-overexpressing MCM7 cells (top panel). (G) qRT-PCR analysis of miR106b cluster in E2F3-overexpressing MCF7 cells and the signals are normalized to U6 internal control. Each data point is a mean ± SD from three or more independent experiments. p < 0.05 were considered as significant.
None
Figure 5. Analysis of p21 regulation in in vitro and ex vivo breast cancer models in response to miR106b-cluster and PD 0332991. (A) qRT-PCR analysis of p21 mRNA and the signals were normalized to GAPDH internal control. (B) Western blotting analysis of p21Cip1/Waf1 and lamin b loading control in MCF7 cells. (C) qRT-PCR analysis of p21 mRNA in RB- and RB+ human solid tumors in response to CDK4/6 inhibitor. (D) qRT-PCR analysis of p21Cip1/Waf1 in response to ectopic expression of precursor mirR 25, 93 and 106b. (E) p21 3′ luciferase activity in MCF7 cells in response to PD 0332991, and signals were normalized to renilla luciferase. (F) p21 3′ luciferase activity in MCF7 cells in response to ectopic expression of precursor mirR 25, 93 and 106b, and signals were normalized to renilla luciferase. (G) p21 3′ luciferase activity in MCF7 cells in response to ectopic expression of anti-mirR 25, 93 and 106b, and signals were normalized to renilla luciferase. Each data point is a mean ± SD from three or more independent experiments. (Tumors, n = 11 ER+RB+ tumors and 2 ER-RB- tumors.) p < 0.05 were considered as significant.
None
Figure 6. Analysis of PTEN regulation in in vitro and ex vivo breast cancer models in response to miR106b-cluster and PD 0332991. (A) qRT-PCR analysis of PTEN mRNA (left panel) and immunoblot (right panel). (B) Immunolocalization of PTEN protein in MCF7 cells. (C) qRT-PCR analysis of PTEN mRNA in RB+ and RB- human solid tumors in response to CDK4/6 inhibitors. (D) qRT-PCR analysis of PTEN mRNA in response to ectopic expression of precursor mirR 25, 93 and 106b in MCF7 cells. (E) PTEN 3′ luciferase activity in MCF7 cells in response to PD 0332991 and signals were normalized to renilla luciferase. (F) PTEN 3′ luciferase activity in MCF7 cells in response to ectopic expression of precursor mirR 25, 93 and 106b, and signals were normalized to renilla luciferase. (G) PTEN 3′ luciferase activity in MCF7 cells in response to ectopic expression of anti-mirR 25, 93 and 106b, and signals were normalized to renilla luciferase. Each data point is a mean ± SD from three or more independent experiments. (tumors n = 11 ER+RB+ tumors and 2 ER-RB- tumors.) p < 0.05 were considered as significant.
None
Figure 7. RNA immunoprecipitation, p21, PTEN mRNA and miR106b-cluster analysis in response to CDK4/6 inhibitor in MCF7 cells. (A) Immunoprecipitation of Ago2, western blot of Ago2 and loading control lamin b. (B) qRT-PCR signals of Ago2 bound p21Cip1/Waf1 and PTEN/MMAC1, GAPDH mRNA in response to DMSO or PD 0332991. (C) qRT-PCR signals of Ago2-bound miR25. (D) qRT-PCR signals of Ago2-bound miR93. (E) qRT-PCR signals of Ago2-bound mi106b, and the signals were normalized to U6 internal control. Each data point is a mean ± SD from three or more independent experiments. p < 0.05 were considered as significant.
None
Figure 8. Functional analysis of miR106b-cluster in MCF7 cells in response to CDK4/6 inhibitor. (A) Flow cytometric analysis of BrdU uptake in MCF7 cells expressing miR106b-cluster (left panel), and QRT-PCR analysis of p21 and PTEN mRNA levels in MCF7 control and cells expressing mir106B-cluster in response PD 0332991 right panel. (B) Wound-healing assay. (C) Cell migration assay/invasion. (D) Quantitation of cell migration/invasion assay. Each data point is a mean ± SD from three or more independent experiments. p < 0.05 were considered as significant.

References

    1. Knudsen ES, Knudsen KE. Tailoring to RB: tumour suppressor status and therapeutic response. Nat Rev Cancer. 2008;8:714–24. doi: 10.1038/nrc2401. - DOI - PMC - PubMed
    1. Burkhart DL, Sage J. Cellular mechanisms of tumour suppression by the retinoblastoma gene. Nat Rev Cancer. 2008;8:671–82. doi: 10.1038/nrc2399. - DOI - PMC - PubMed
    1. Goodrich DW. The retinoblastoma tumor-suppressor gene, the exception that proves the rule. Oncogene. 2006;25:5233–43. doi: 10.1038/sj.onc.1209616. - DOI - PMC - PubMed
    1. Mittnacht S. Control of pRB phosphorylation. Curr Opin Genet Dev. 1998;8:21–7. doi: 10.1016/S0959-437X(98)80057-9. - DOI - PubMed
    1. Wang JY, Knudsen ES, Welch PJ. The retinoblastoma tumor suppressor protein. Adv Cancer Res. 1994;64:25–85. doi: 10.1016/S0065-230X(08)60834-9. - DOI - PubMed

Publication types

MeSH terms