. 2013 Jan 15;12(2):332-45.
doi: 10.4161/cc.23177. Epub 2012 Jan 15.

Separation of intra-S checkpoint protein contributions to DNA replication fork protection and genomic stability in normal human fibroblasts

Affiliations

Separation of intra-S checkpoint protein contributions to DNA replication fork protection and genomic stability in normal human fibroblasts

Stephanie L Smith-Roe et al. Cell Cycle. .

Abstract

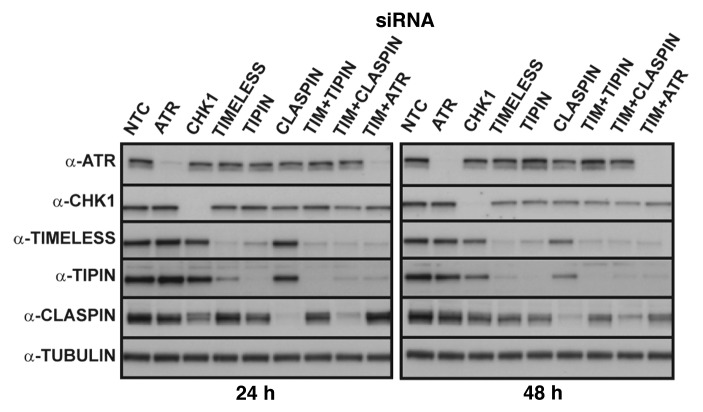
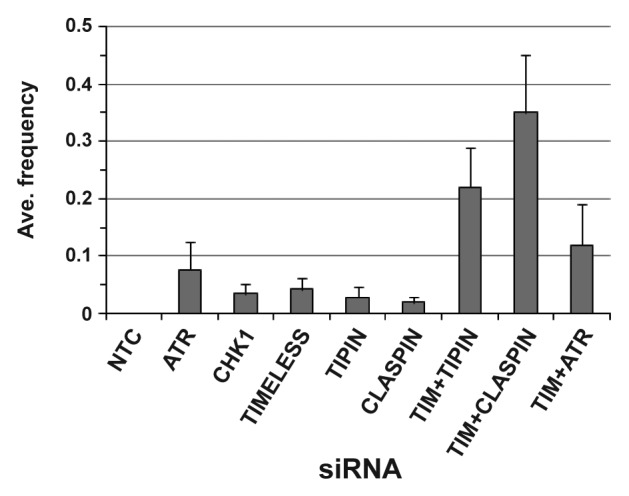
The ATR-dependent intra-S checkpoint protects DNA replication forks undergoing replication stress. The checkpoint is enforced by ATR-dependent phosphorylation of CHK1, which are mediated by the TIMELESS-TIPIN complex and CLASPIN. Although loss of checkpoint proteins is associated with spontaneous chromosomal instability, few studies have examined the contribution of these proteins to unchallenged DNA metabolism in human cells that have not undergone carcinogenesis or crisis. Furthermore, the TIMELESS-TIPIN complex and CLASPIN may promote replication fork protection independently of CHK1 activation. Normal human fibroblasts (NHF) were depleted of ATR, CHK1, TIMELESS, TIPIN or CLASPIN and chromosomal aberrations, DNA synthesis, activation of the DNA damage response (DDR) and clonogenic survival were evaluated. This work demonstrates in NHF lines from two individuals that ATR and CHK1 promote chromosomal stability by different mechanisms that depletion of CHK1 produces phenotypes that resemble more closely the depletion of TIPIN or CLASPIN than the depletion of ATR, and that TIMELESS has a distinct contribution to suppression of chromosomal instability that is independent of its heterodimeric partner, TIPIN. Therefore, ATR, CHK1, TIMELESS-TIPIN and CLASPIN have functions for preservation of intrinsic chromosomal stability that is separate from their cooperation for activation of the intra-S checkpoint response to experimentally induced replication stress. These data reveal a complex and coordinated program of genome maintenance enforced by proteins known for their intra-S checkpoint function.

Keywords: ATR; CHK1; CLASPIN; TIMELESS; TIPIN; chromosomal aberration; genome maintenance; human fibroblast; intra-S checkpoint; replication fork protection.


Figures

None
Figure 1. Representative western blots from a single experiment showing ≥ 95% depletion of checkpoint proteins from NHF1-hTERT at 24 or 48 h after electroporation of siRNAs.
None
Figure 2. Chromosomal aberrations observed in Giemsa-stained metaphases produced from NHF1-hTERT depleted of checkpoint proteins. Frequency of breaks, gaps and exchanges at 24h (A) or 48 h (B) after introduction of siRNAs (error bars show + SEM for overall frequency of aberrations). Average frequency = total number of aberrations divided by the total number of metaphases evaluated per independent experiment, then averaged across independent experiments. Incidence of metaphases with at least one chromosomal aberration (C). Graphs represent averages of three or more experiments (+ S.D.). Markers indicate degree of statistical difference from NTC siRNA control: # p < 0.01, * p < 0.005, ** p < 0.0005, *** p < 0.0001. Representative pictures of chromosomal aberrations: chromatid break (D) and gap (E) from NHF1-hTERT electroporated with ATR siRNA; an incomplete, complex exchange (F) and a radial exchange (G) from NHF1-hTERT electroporated with TIMELESS and TIPIN siRNAs.
None
Figure 3. Average frequency of exchanges when data from NHF1-hTERT and NHF10-hTERT were combined. Each bar depicts averages of five or more independent experiments (+ S.D.). The TIMELESS+TIPIN siRNA exchange frequency was statistically different from the exchange frequencies of TIMELESS or TIPIN siRNAs (p < 0.0001 for both comparisons), and the TIMELESS+CLASPIN siRNA exchange frequency was statistically different from the exchange frequencies of TIMELESS or CLASPIN siRNAs (p < 0.0001 for both comparisons). The TIMELESS+ATR siRNA exchange frequency was not statistically different from the ATR siRNA exchange frequency (p = 0.14).
None
Figure 4. Cells depleted of TIMELESS or TIPIN exhibit ATR-dependent phosphorylation of CHK1 mediated by CLASPIN. Representative western blots from a single experiment depicting phosphorylation of CHK1 at S345 at 24 or 48 h after introduction of siRNAs (A). ImageJ software was used to normalize P-CHK1 S345 to total CHK1 and the results were expressed as average fold change compared with NTC. (B) Graph depicts average of three experiments (+ S. D.).
None
Figure 5. NHF1-hTERT depleted of checkpoint proteins exhibit reduced BrdU incorporation and alterations in cell cycle progression. Bivariate plots from a single experiment show linear propidium iodide signal (DNA content) vs. log signal of anti-BrdU directly conjugated to AlexaFluor 488 at 24 h (A) or 48 h (B) after introduction of siRNAs. Three regions were drawn on the profiles to define G1, G2 and normal S phase (A) populations. Two regions were drawn to define aberrant S phase (B and C). Cells with > 2N and < 4N DNA content above the G1 and G2 regions but below the S phase region defined by the NTC profile showed reduced BrdU incorporation (B). Cells with > 2N and < 4N DNA content that fell below the G1/S and G2/S boundaries showed failure to incorporate BrdU (C). Average percent of cells with S-phase DNA content within the whole population partitioned by those showing normal BrdU incorporation, reduced BrdU incorporation and no BrdU incorporation obtained from four or more experiments (+ S.D.). (C and D) Except for ATR siRNA, the percent of cells showing reduced or no incorporation of BrdU was statistically different (p < 0.0001) from NTC siRNA for all of the depletions at 24 h (C) and 48 h (D) time points. (E and F) Replicate experiments were first normalized to the matched NTC flow cytometry profile before comparison across experiments. Regions drawn on NTC profiles for G1, G2 and all cells with S-phase DNA content were applied to depletion profiles and used to calculate the fold change compared with NTC siRNA. All depletions were statistically different (p < 0.05) from NTC siRNA for G1 except ATR and CHK1 at 24 and 48 h, and TIPIN, CLASPIN and TIMELESS+TIPIN at 48 h. Depletions that were statistically different (p < 0.05) from NTC siRNA for S phase included TIMELESS and TIMELESS+ATR at 24 and 48 h, TIMELESS+CLASPIN at 24 h. All depletions were statistically different (p < 0.05) from NTC siRNA for G2 except ATR at 24 and 48 h, CHK1 and TIMELESS+ATR at 24 h.
None
Figure 6. Depletion of checkpoint proteins in NHF1-hTERT activates the DNA-damage response (DDR). Representative western blots from a single experiment showing phosphorylation and/or upregulation of DDR biomarkers at 24 or 48 h after introduction of siRNAs (A). Western blots from Figures 1 and 6 were from the same experiment. ImageJ software was used to normalize phospho-protein levels to total protein levels (B). In order to compare across experiments and different antibodies, the fold change in phosphorylation over the NTC siRNA control of the largest effect was set as the maximal (100%) signal for each experiment and then the results of each experiment were averaged. The data from the two time points were combined as the pattern of induced phosphorylation was not different. Graph depicts average of three experiments (+ S.D.).
None
Figure 7. Clonal expansion of NHF1-hTERT depleted of checkpoint proteins in the absence of applied DNA damage. Graph depicts averages of three or more experiments (+ S.D.).
None
Figure 8. Unsupervised, hierarchical cluster heat map comparison of various experimental outcomes after checkpoint protein depletion from NHF1-hTERT. In order to make relative comparisons between siRNAs and phenotypic outcomes, the siRNA that produced the highest effect for each independent experiment was set to 100% and all the other values were expressed relative to the highest value for that experiment. Once converted to a scale of 1–100, the converted values were averaged. Determinations are from data obtained at 48 h post-electroporation except for clonogenic expansion data and for western blot data. Western blot data from 24 and 48 h data were combined as the patterns of activation were similar. Scaling of sister chromatid discohesion was generated from Smith-Roe et al. (2011). The effect of co-targeting TIMELESS and ATR on SCC was not reported in Smith-Roe et al. (2011), but is reported here as 4.7 ± 2.5% for NHF1-hTERT (scaled into Fig. 8) and 30.5 ± 12.6% for NHF10-hTERT.

References

    1. Paulsen RD, Cimprich KA. The ATR pathway: fine-tuning the fork. DNA Repair (Amst) 2007;6:953–66. doi: 10.1016/j.dnarep.2007.02.015. - DOI - PubMed
    1. Kaufmann WK. The human intra-S checkpoint response to UVC-induced DNA damage. Carcinogenesis. 2010;31:751–65. doi: 10.1093/carcin/bgp230. - DOI - PMC - PubMed
    1. Nam EA, Cortez D. ATR signalling: more than meeting at the fork. Biochem J. 2011;436:527–36. doi: 10.1042/BJ20102162. - DOI - PMC - PubMed
    1. MacDougall CA, Byun TS, Van C, Yee MC, Cimprich KA. The structural determinants of checkpoint activation. Genes Dev. 2007;21:898–903. doi: 10.1101/gad.1522607. - DOI - PMC - PubMed
    1. Zou L, Elledge SJ. Sensing DNA damage through ATRIP recognition of RPA-ssDNA complexes. Science. 2003;300:1542–8. doi: 10.1126/science.1083430. - DOI - PubMed

Publication types

MeSH terms

LinkOut - more resources