

Cardiomyocyte proliferation and progenitor cell recruitment underlie therapeutic regeneration after myocardial infarction in the adult mouse heart
- PMID: 23255322
- PMCID: PMC3569637
- DOI: 10.1002/emmm.201201737
Cardiomyocyte proliferation and progenitor cell recruitment underlie therapeutic regeneration after myocardial infarction in the adult mouse heart
Abstract
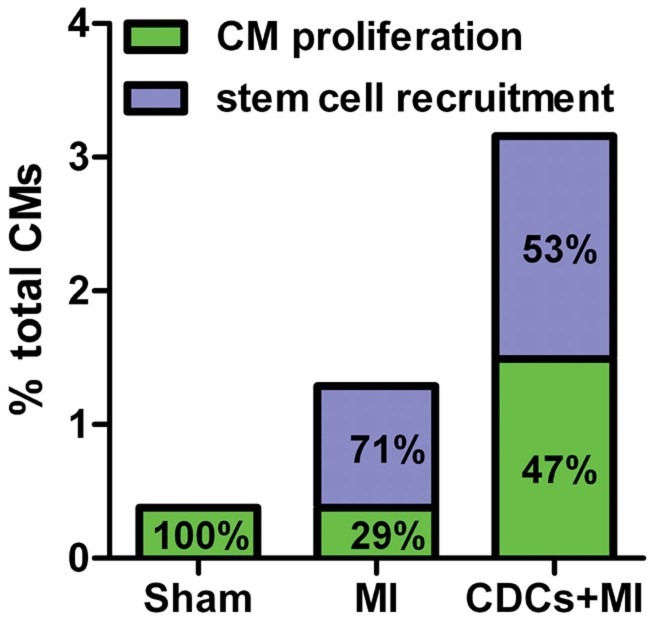
Cardiosphere-derived cells (CDCs) have been shown to regenerate infarcted myocardium in patients after myocardial infarction (MI). However, whether the cells of the newly formed myocardium originate from the proliferation of adult cardiomyocytes or from the differentiation of endogenous stem cells remains unknown. Using genetic fate mapping to mark resident myocytes in combination with long-term BrdU pulsing, we investigated the origins of postnatal cardiomyogenesis in the normal, infarcted and cell-treated adult mammalian heart. In the normal mouse heart, cardiomyocyte turnover occurs predominantly through proliferation of resident cardiomyocytes at a rate of ∼1.3-4%/year. After MI, new cardiomyocytes arise from both progenitors as well as pre-existing cardiomyocytes. Transplantation of CDCs upregulates host cardiomyocyte cycling and recruitment of endogenous progenitors, while boosting heart function and increasing viable myocardium. The observed phenomena cannot be explained by cardiomyocyte polyploidization, bi/multinucleation, cell fusion or DNA repair. Thus, CDCs induce myocardial regeneration by differentially upregulating two mechanisms of endogenous cell proliferation.
Copyright © 2013 The Authors. Published by John Wiley and Sons, Ltd on behalf of EMBO.
Figures
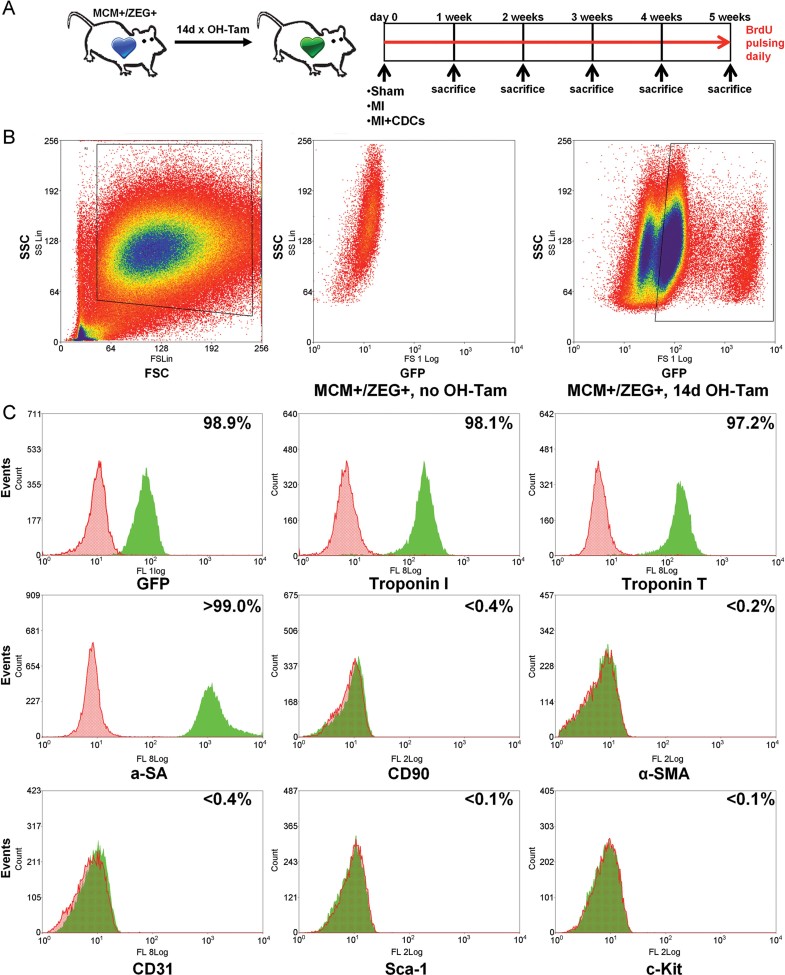
Study schematic. A tamoxifen-inducible cardiomyocyte-specific genetic fate mapping approach was employed, utilizing the MerCreMEr/ZEG mouse strain.
Fluorescence-activated cell sorting of enzymatically dispersed myocardial cell preparations obtained from 4-OH Tamoxifen pulsed and non-pulsed bitransgenic (control) mice. Cells were initially gated on the basis of size (Forward scatter; FSC) and granularity (Side scatter; SSC) and subsequently sorted based on expression of GFP, a specific marker for endogenous cardiomyocytes. Boxes denote the boundaries of sorted populations.
Flow cytometric analysis for assessment of purity of FACS-sorted GFP+ cardiomyocytes. Markers include troponin T, troponin I, and α-sarcomeric actinin (for cardiomyocytes), CD90 (for mesenchymal cells and fibroblasts), α-smooth muscle actin (α-SMA) (for smooth muscle cells), CD31 (for endothelial cells), c-Kit and Sca-1 (for progenitor cells).
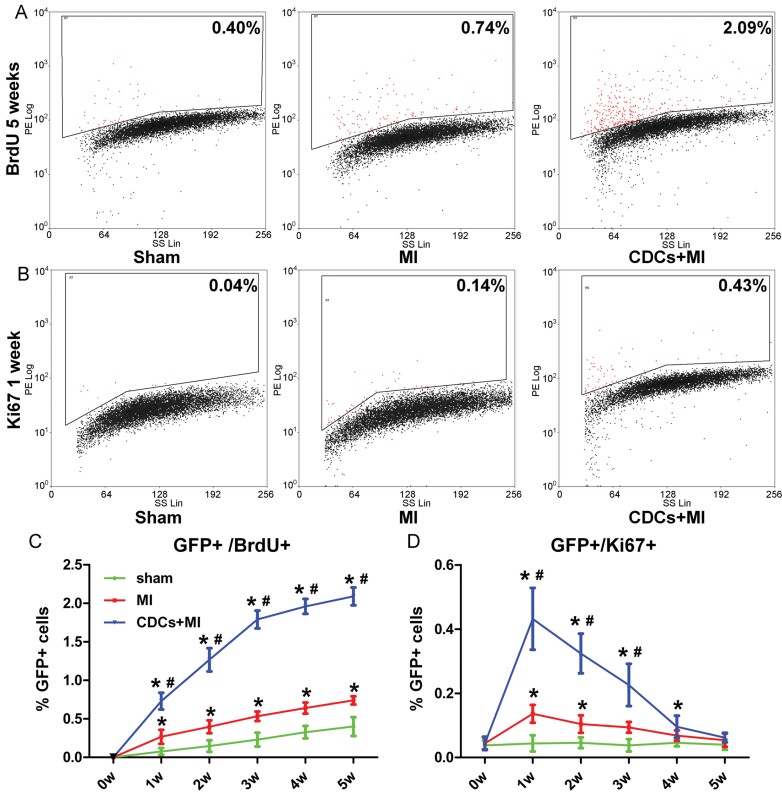
A–D. Flow cytometric analysis of GFP+ sorted cardiomyocytes for BrdU incorporation (A,C) and Ki67 expression (B,D) reveals that the young adult heart contains a small pool of cycling resident cardiomyocytes that increases after MI and is upregulated by CDC therapy. Numbers in flow cytometry plots indicate averages for groups. Red dots indicate BrdU/Ki67+ resident cardiomyocytes while black dots indicate BrdU/Ki67− resident cardiomyocytes (colour gating has been applied to the images) (*p < 0.05 compared to sham; #p < 0.05 compared to MI, n = 3–5/group/timepoint). All error bars represent SDs. One-way ANOVA followed by LSD post hoc test was used for statistical analysis (C: MI vs sham: 1w p = 0.035, 2w p = 0.031, 3w p = 0.007, 4w p = 0.004, 5w p = 0.006; CDCs vs sham: 1w p < 0.001, 2w p < 0.001, 3w p < 0.001, 4w p < 0.001, 5w p < 0.001; CDCs vs MI: 1w p = 0.001, 2w p < 0.001, 3w p < 0.001, 4w p < 0.001, 5w p < 0.001; D: MI vs sham: 1w p = 0.031, 2w p = 0.041, 3w p = 0.049; CDCs vs sham: 1w p < 0.001, 2w p < 0.001, 3w p < 0.001, 4w p = 0.005; CDCs vs MI: 1w p < 0.001, 2w p < 0.001, 3w p < 0.001; all other p = ns).
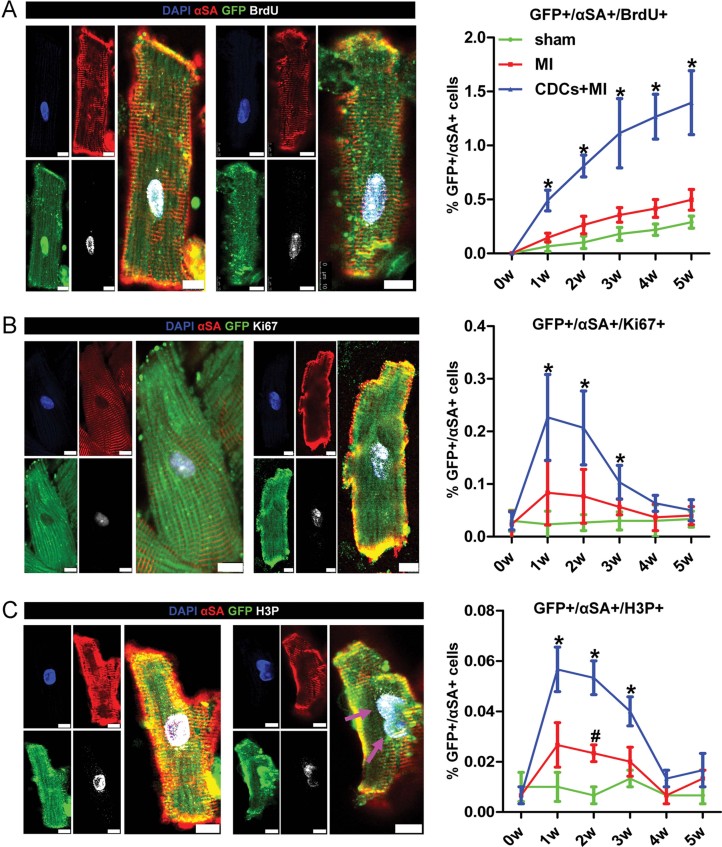
A–C. Immunocytochemistry of enzymatically dissociated cardiomyocytes for GFP, αSA and BrdU (A), Ki67 (B), H3P (C) reveals that the young adult heart contains a small pool of cycling resident cardiomyocytes that increases after MI and is upregulated by CDC therapy. Arrows in (C) show an example of karyokinesis (*p < 0.05 compared to sham, MI, #p < 0.05 compared to sham only, n = 3/group/timepoint). All error bars represent SDs. One-way ANOVA followed by LSD post hoc test was used for statistical analysis (A: CDCs vs sham: 1w p < 0.001, 2w p < 0.001, 3w p = 0.001, 4w p < 0.001, 5w p < 0.001; CDCs vs MI: 1w p = 0.001, 2w p < 0.001, 3w p = 0.003, 4w p < 0.001, 5w p = 0.001; B: CDCs vs sham: 1w p = 0.006, 2w p = 0.005, 3w p = 0.008; CDCs vs MI: 1w p = 0.027, 2w p = 0.021, 3w p = 0.046; C: MI vs sham 2w p = 0.020; CDCs vs sham: 1w p = 0.009, 2w p < 0.001, 3w p = 0.011; CDCs vs MI: 1w p = 0.038, 2w p = 0.003, 3w p = 0.046; all other p = ns). All scale bars: 10 µm.
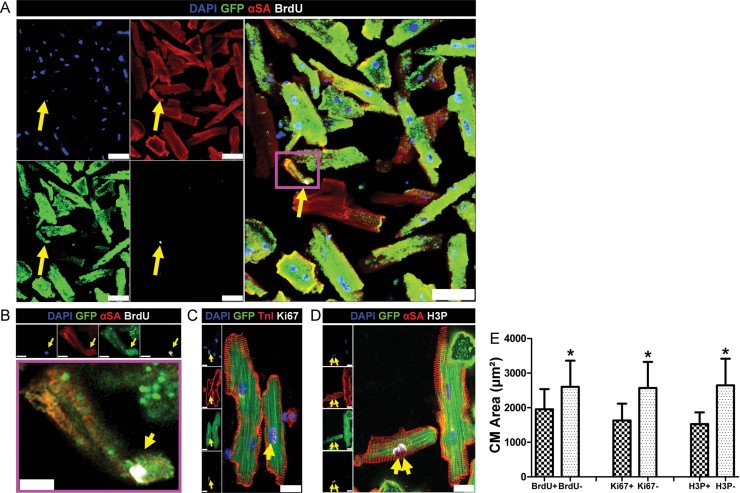
A–D. Immunocytochemistry of enzymatically dissociated cardiomyocytes reveals that cycling resident cardiomyocytes (GFP+, αSA+, BrdU+/KI67+/H3P+) were smaller compared to non-cycling cardiomyocytes (GFP+, αSA+, BrdU−/KI67−/H3P−) and more often mononucleated. (B) is a higher power image of inset in (A). Arrows in (D) show an example of karyokinesis. Scale bars: 50 µm (A), 10 µm (B), 20 µm (C,D).
E. Quantitative analysis of cardiomyocyte area in cycling versus non-cycling cardiomyocytes. (*p < 0.05 compared to cycling cells, n = 10/group). All error bars represent SDs. Independent samples t-test was used for statistical analysis (BrdU+ vs BrdU− p = 0.046; Ki67+ vs Ki67− p = 0.004; H3P+ vs H3P− p = 0.001).
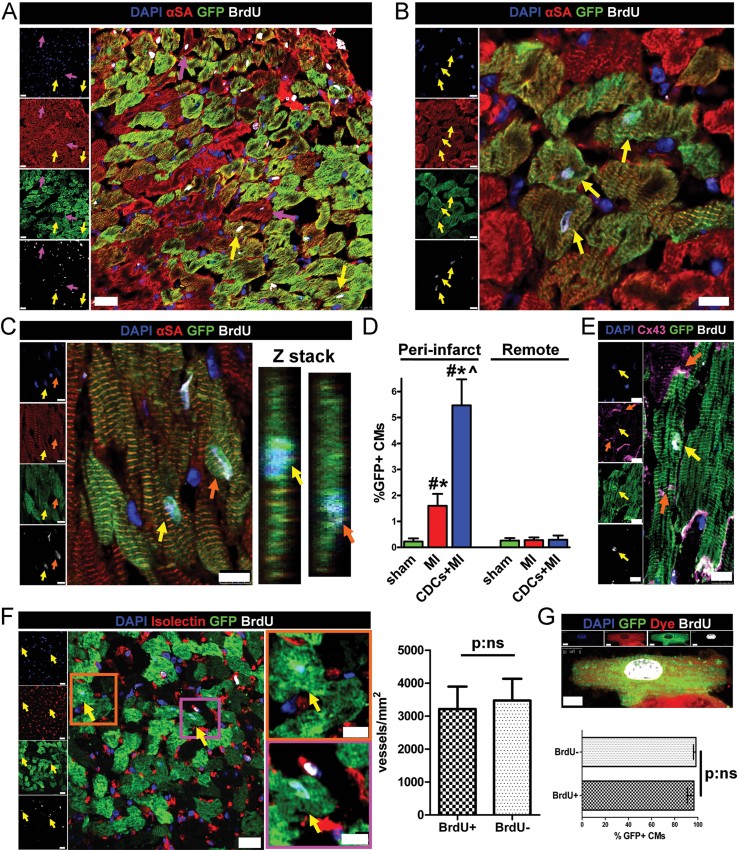
A–C. BrdU+/GFP+ resident cardiomyocytes in the peri-infarct area are indicated by yellow arrows in (A–C) and orange arrows in (C). Purple arrows in (A) show BrdU+/GFP− cardiomyocytes. Z-stacks in (C) reveal that the BrdU+ nuclei belong to cardiomyocytes.
D. Quantification of the rates of cycling endogenous cardiomyocytes by immunohistochemistry reveals that ∼90% of GFP+/αSA+/BrdU+ cardiomyocytes were located in the peri-infarct area after MI and CDC therapy (*p < 0.05 compared to remote, #p < 0.05 compared to sham, ∧p < 0.05 compared to MI, n = 3–5/group). One-way ANOVA followed by LSD post hoc test and independent samples t-test were used for statistical analysis (MI vs sham p = 0.039; CDCs vs sham p < 0.001; CDCs vs MI p < 0.001; MI peri-infarct vs remote p = 0.008; CDCs peri-infarct vs remote p = 0.001; all other p = ns).
E. Immunohistochemistry reveals that BrdU+ resident cardiomyocytes (yellow arrows) are connected with gap junctions (orange arrows) to neighbouring BrdU− cardiomyocytes.
F. Vessel density was similar in areas of the border zone that contained BrdU+/GFP+ resident cardiomyocytes (yellow arrows; images on the right are high power images of insets on left) compared to areas that did not contain BrdU+ cardiomyocytes (n = 3/group). Independent samples t-test was used for statistical analysis.
G. After ex vivo retrograde perfusion with Celltracker RED dye the percentage of Celltracker RED+ cardiomyocytes did not differ between BrdU+ and BrdU− GFP+ cardiomyocytes, verifying that cycling myocytes are normally perfused (n = 3/group). Independent samples t-test was used for statistical analysis. All error bars represent SDs. Scale bars: 20 µm (A,F), 10 µm (B,C,E,F[high power],G).
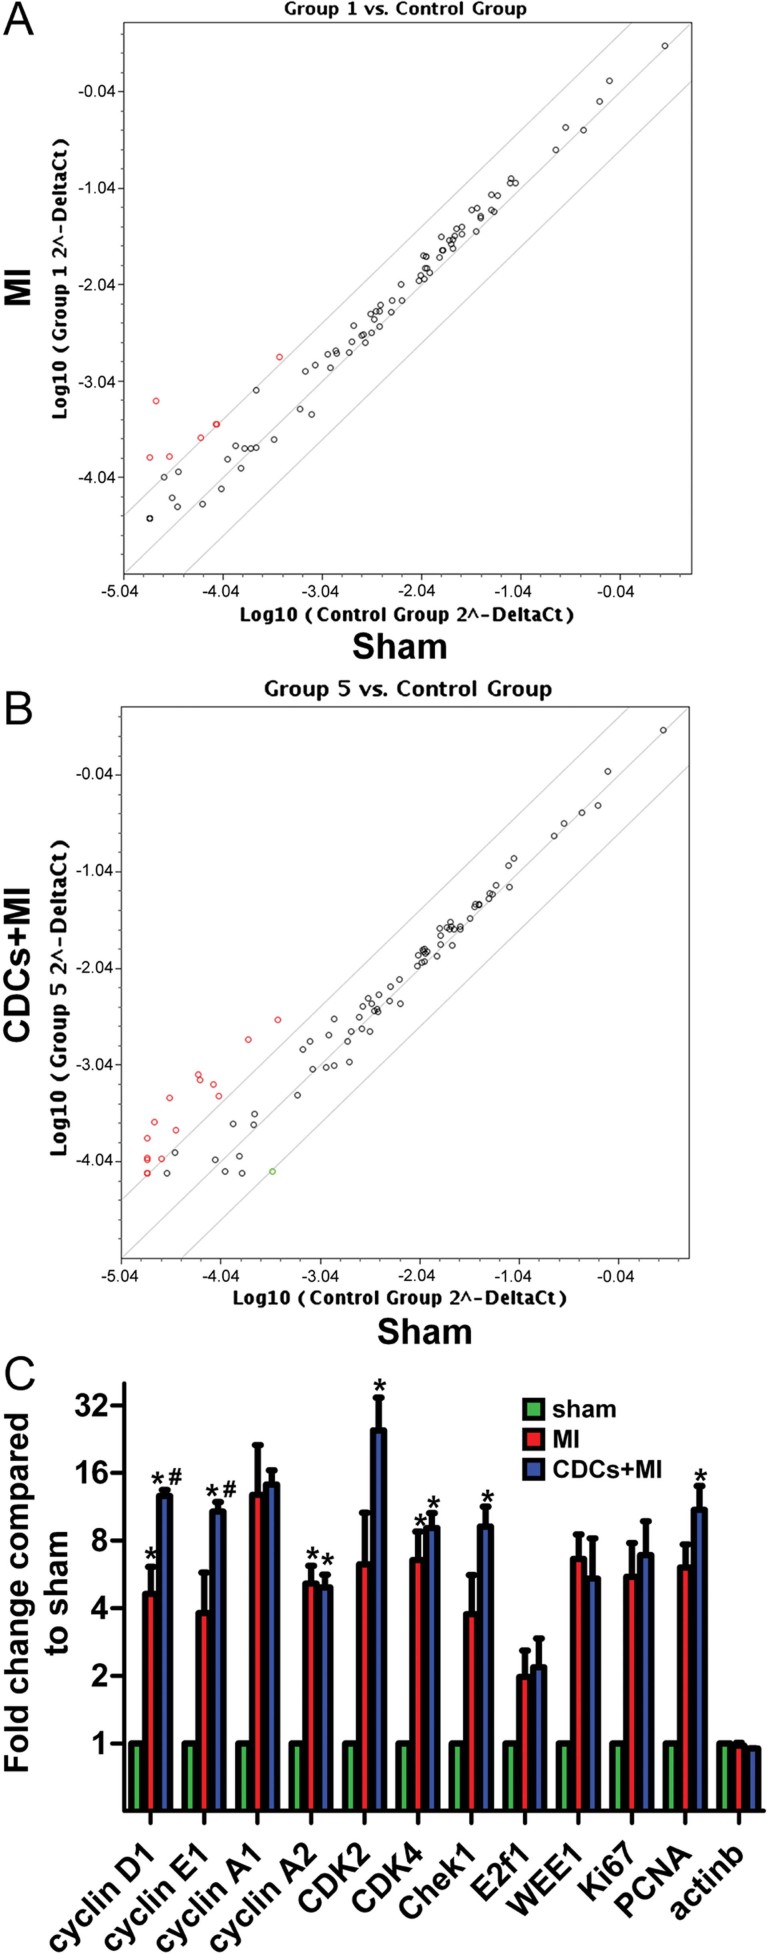
A, B. Representative scatter plots of PCR microarray analysis of RNA isolated from GFP+ FACS-sorted cardiomyocytes for cell-cycle associated genes showing increased expression of positive cell-cycle regulators post-MI (red dots) compared to sham-operated animals (A), changes which are further upregulated after CDC therapy (B).
C. Quantitative analysis of PCR microarray data. Results are presented as fold change compared to sham and were calculated using the ΔΔCt method. B-Actin was used as a control. (*p < 0.05 compared to sham; #p < 0.05 compared to MI, n = 3/group). All error bars represent SDs. One-way ANOVA followed by LSD post hoc test was used for statistical analysis (cyclin D1: MI vs sham p = 0.047, CDCs vs sham p = 0.001, CDCs vs MI p = 0.004; cyclin E1: CDCs vs sham p = 0.005, CDCs vs MI p = 0.02; cyclin A2: MI vs sham p = 0.009, CDCs vs sham p = 0.016, CDK4: MI vs sham p = 0.047, CDCs vs sham p = 0.019, Chek1: CDCs vs sham p = 0.014, PCNA: CDCs vs sham p = 0.009; all other p = ns).
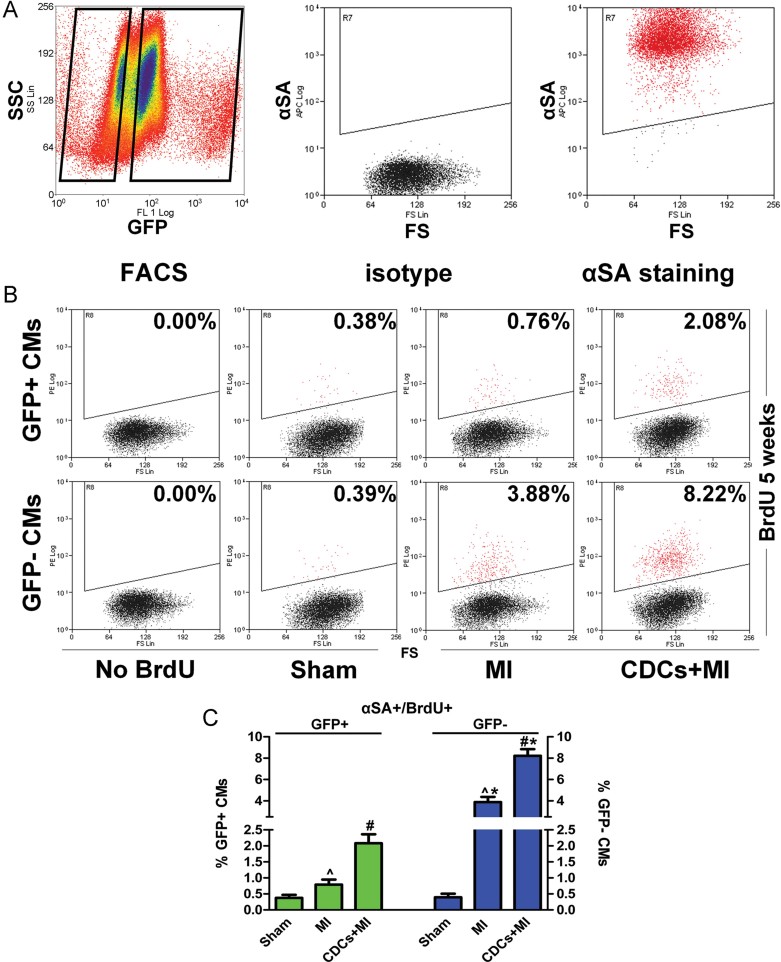
A. FACS-sorted GFP+ and GFP− cardiomyocytes were subsequently stained for αSA. Only αSA+ cells were examined.
B, C. Flow cytometric analysis of GFP+/αSA+ and GFP−/αSA+ cardiomyocytes for BrdU incorporation reveals that, in the normal mouse heart, cardiomyocyte turnover occurs exclusively through proliferation of adult cardiomyocytes. After MI, cardiomyocyte proliferation is upregulated, while progenitor cells also contribute to the replacement of lost cardiomyocytes. CDCs amplify both stem cell-mediated myocyte replenishment and adult cardiomyocyte proliferation. Numbers in flow cytometry plots indicate averages for groups. Red dots indicate BrdU+ while black dots indicate BrdU− cardiomyocytes (colour gating has been applied to the images). (*p < 0.05 compared to GFP+ cardiomyocytes; #p < 0.05 compared to MI and sham; ∧p < 0.05 to sham; n = 5/group). All error bars represent SDs. One-way ANOVA followed by LSD post hoc test and independent samples t-test were used for statistical analysis (GFP+: MI vs sham: p = 0.01, CDCs vs sham p < 0.001, CDCs vs MI p < 0.001; GFP−: MI vs sham: p < 0.001, CDCs vs sham p < 0.001, CDCs vs MI p < 0.001; GFP+ vs GFP− MI p < 0.001, GFP+ vs GFP− CDCs p < 0.001; all other p = ns).
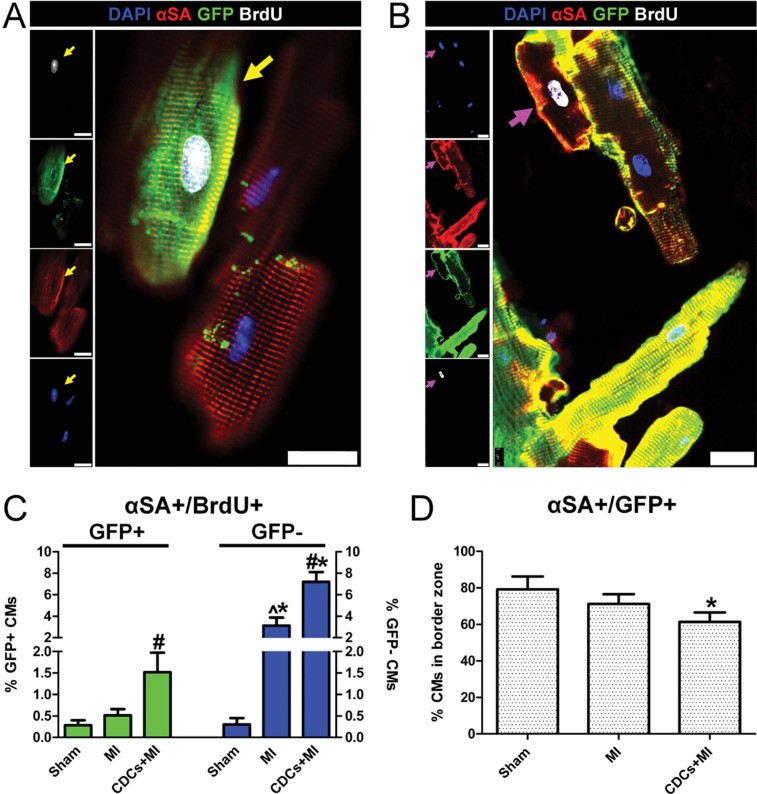
A–C. Immunocytochemistry of enzymatically dissociated cardiomyocytes for GFP, αSA and BrdU reveals that, in the normal mouse heart, cardiomyocyte turnover occurs exclusively through proliferation of adult cardiomyocytes. After MI, cardiomyocyte proliferation is upregulated, while progenitor cells also contribute to the replacement of lost cardiomyocytes. CDCs amplify both stem cell-mediated myocyte replenishment and adult cardiomyocyte proliferation. Arrows in (A) indicate a GFP+/BrdU+ cardiomyocyte. Arrows in (B) show a GFP−/BrdU+ cardiomyocyte. (*p < 0.05 compared to GFP+ cardiomyocytes; #p < 0.05 compared to MI and sham, ∧p < 0.05 compared to sham; n = 5/group). One-way ANOVA followed by LSD post hoc test and independent samples t-test were used for statistical analysis (GFP+: CDCs vs sham p < 0.001, CDCs vs MI p < 0.001; GFP−: MI vs sham: p < 0.001, CDCs vs sham p < 0.001, CDCs vs MI p < 0.001; GFP+ vs GFP− MI p = 0.001, GFP+ vs GFP− CDCs p < 0.001; all other p = ns).
D. Immunocytochemistry of enzymatically dissociated cardiomyocytes reveals that the percentage of GFP+ cardiomyocytes in the infarct border zone decreases post MI and is further decreased post CDC therapy, indicating contribution of endogenous progenitors to the myocyte pool (*p < 0.05 compared to sham, MI; n = 5/group). One-way ANOVA followed by LSD post hoc test was used for statistical analysis (CDCs vs sham p < 0.001; CDCs vs MI p = 0.023; all other p = ns). All error bars represent SDs. All scale bars: 20 µm.
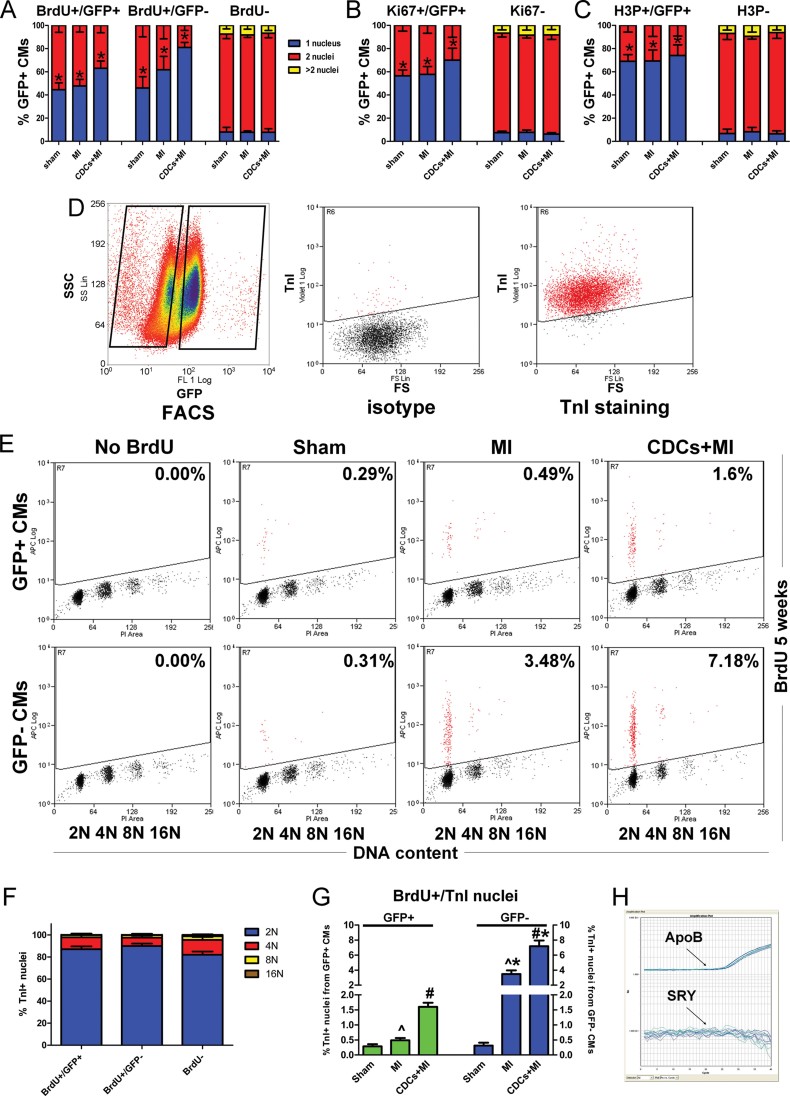
A–C. Immunocytochemistry of enzymatically dissociated myocytes reveals that cycling (BrdU+, Ki67+, H3P+) GFP+ and GFP− myocytes are more often mononucleated compared to non-cycling myocytes, thus excluding a prominent role of bi/multinucleation (*p < 0.05 compared to non-cycling cells, n = 4/group). One-way ANOVA followed by LSD post hoc test (A) and independent samples t-test (B,C) were used for statistical analysis (A: sham: BrdU+/GFP+ vs BrdU− p < 0.001, BrdU+/GFP− vs BrdU− p < 0.001; MI: BrdU+/GFP+ vs BrdU− p < 0.001, BrdU+/GFP− vs BrdU− p < 0.001; CDCs: BrdU+/GFP+ vs BrdU− p < 0.001, BrdU+/GFP− vs BrdU− p < 0.001; B: sham: KI67+/GFP+ vs Ki67− p < 0.001; MI: Ki67+/GFP+ vs Ki67− p < 0.001; CDCs: Ki67+/GFP+ vs Ki67− p = 0.001; C: sham: H3P+/GFP+ vs H3P− p < 0.001; MI H3P+/GFP+ vs H3P− p < 0.001; CDCs: H3P+/GFP+ vs H3P− p < 0.001; all other p = ns).
D. Nuclei isolated form FACS-sorted GFP+ and GFP− cardiomyocytes were stained for TnI. Only TnI+ nuclei were examined.
E. Flow cytometric analysis of isolated TnI+ nuclei from GFP+ and GFP− FACS-sorted cardiomyocytes reveals that 87–90% of TnI+/BrdU+ nuclei are diploid, thus excluding a prominent role of bi/multinucleation (n = 4/group) Numbers in flow cytometry plots indicate averages for groups.
F. Ploidy distributions did not differ significantly between BrdU+/TnI+ nuclei (obtained from GFP+ or GFP− cardiomyocytes) and BrdU−/TnI+ nuclei (n = 4/group). One-way ANOVA followed by LSD post hoc test was used for statistical analysis.
G. Percentages of BrdU+/TnI+ nuclei are similar to those obtained from flow cytometric analysis of whole cells (*p < 0.05 compared to nuclei from GFP+ cardiomyocytes; #p < 0.05 compared to MI and sham, ∧p < 0.05 compared to sham; n = 4/group). One-way ANOVA followed by LSD post hoc test and independent samples t-test were used for statistical analysis (GFP+: MI vs sham: p = 0.018, CDCs vs sham p < 0.001, CDCs vs MI p < 0.001; GFP−: MI vs sham: p < 0.001, CDCs vs sham p < 0.001, CDCs vs MI p < 0.001; GFP+ vs GFP− MI p < 0.001, GFP+ vs GFP− CDCs p < 0.001; all other p = ns). All error bars represent SDs.
H. DNA was extracted from GFP+ and GFP− FACS-sorted cells obtained from female infarcted hearts injected with male CDCs. qPCR experiments using the male-specific SRY gene as a target resulted in no amplification, revealing no detectable fusion of exogenous CDCs with endogenous cardiomyocytes (n = 3).
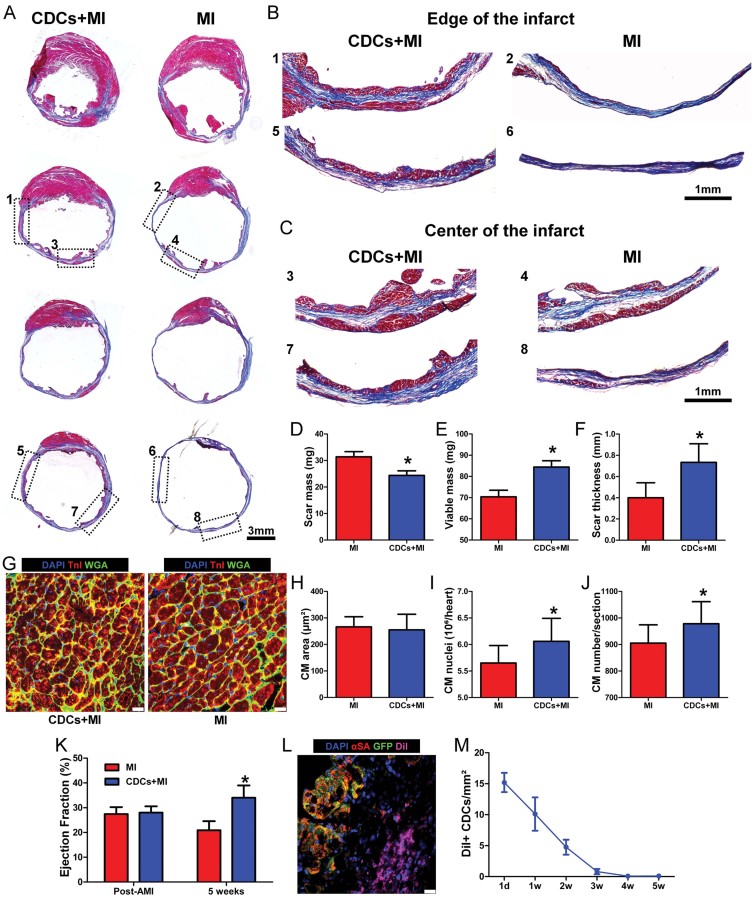
A–C. Representative images of Masson's Trichrome-stained infarcted mouse hearts at 5 weeks post MI. Viable heart muscle stains red, while scar stains blue. Four consecutive sections per heart (obtained at 500 µm intervals, starting from the level of LAD ligation towards the apex) are presented. Note that the level of first section is similar, as manifested by the similar structure of the papillary muscles. Images in (B,C) are higher power images of the insets in (A), showing increased viable myocardium at the edges (B) and at the center (C) of the infarct in CDC-treated hearts.
D–F. Morphometric analysis of CDC-treated and control hearts. CDC transplantation led to significant reduction of scar mass (p = 0.027) (D), increase of viable myocardium (p = 0.038) (E) and increased infarcted wall thickness (p = 0.005) (F), compared to control animals (n = 5–6/group).
G. Representative images of the border zone revealing no myocyte hypertrophy in CDC-treated hearts.
H. Border zone cardiomyocyte cross-sectional area did not differ significantly between groups (n = 10/group).
I. Quantitative analysis of cardiomyocyte nuclei per heart (n = 10/group; p = 0.029).
J. Quantitative analysis of cardiomyocytes per heart section (n = 10/group; p = 0.047).
K. Echocardiographic assessment of LV function reveals that CDC transplantation resulted in superior global function (p < 0.001) compared to controls (n = 9/group).
L, M. CDC engraftment as determined by immunohistochemistry after administration of DiI-labelled cells. Long-term cell survival beyond 3 weeks post-MI is low (n = 2/timepoint). All error bars represent SDs (*p < 0.05 compared to infarcted controls). All error bars represent SDs. Independent samples t-test was used for statistical analysis. Scale bars: 3 mm (A), 1 mm (B,C), 20 µm (G,L).
Comment in
-
Heart to heart: grafting cardiosphere-derived cells augments cardiac self-repair by both myocytes and stem cells.EMBO Mol Med. 2013 Feb;5(2):177-9. doi: 10.1002/emmm.201202345. EMBO Mol Med. 2013. PMID: 23382000 Free PMC article. No abstract available.
References
-
- Angeli FS, Amabile N, Burjonroppa S, Shapiro M, Bartlett L, Zhang Y, Virmani R, Chatterjee K, Boyle A, Grossman W, et al. Prolonged therapy with erythropoietin is safe and prevents deterioration of left ventricular systolic function in a porcine model of myocardial infarction. J Card Fail. 2010;16:579–589. - PubMed
-
- Alvarez-Dolado M, Pardal R, Garcia-Verdugo JM, Fike JR, Lee HO, Pfeffer K, Lois C, Morrison SJ, Alvarez-Buylla A. Fusion of bone-marrow-derived cells with Purkinje neurons, cardiomyocytes and hepatocytes. Nature. 2003;425:968–973. - PubMed
-
- Beltrami AP, Urbanek K, Kajstura J, Yan SM, Finato N, Bussani R, Nadal-Ginard B, Silvestri F, Leri A, et al. Evidence that human cardiac myocytes divide after myocardial infarction. N Engl J Med. 2001;344:1750–1757. - PubMed
Publication types
MeSH terms
Grants and funding
LinkOut - more resources
Full Text Sources
Other Literature Sources
Medical
