

Peptide length determines the outcome of TCR/peptide-MHCI engagement
- PMID: 23255554
- PMCID: PMC3653566
- DOI: 10.1182/blood-2012-06-437202
Peptide length determines the outcome of TCR/peptide-MHCI engagement
Abstract
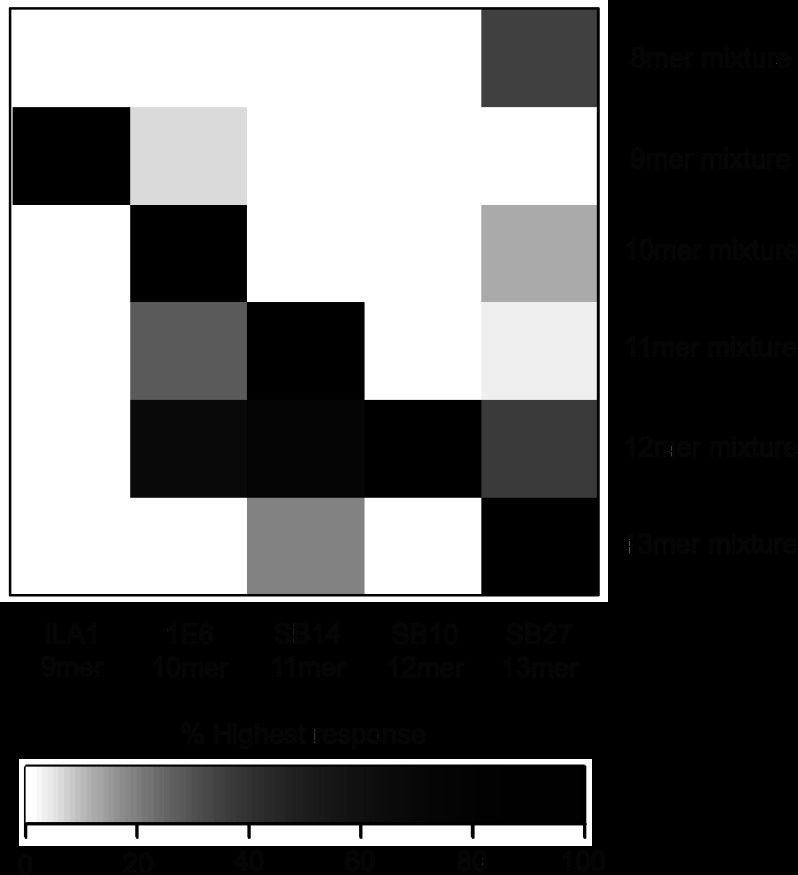
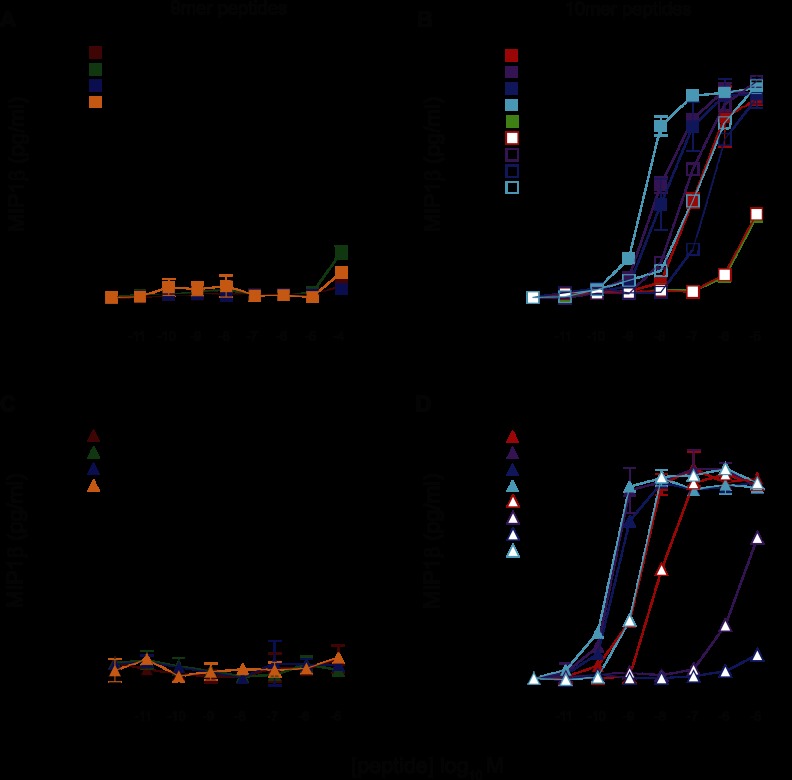
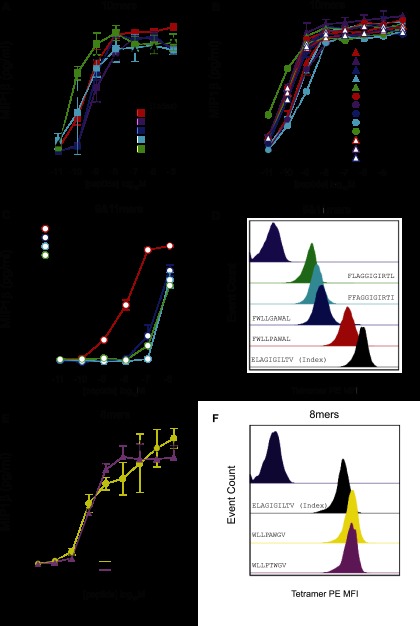
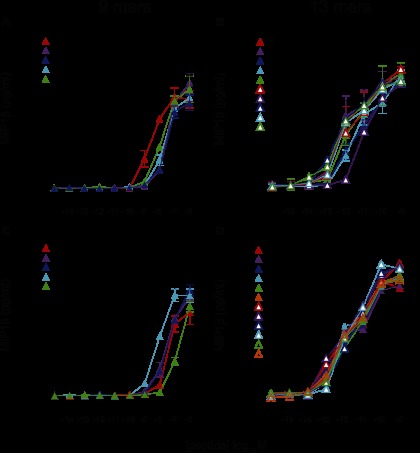
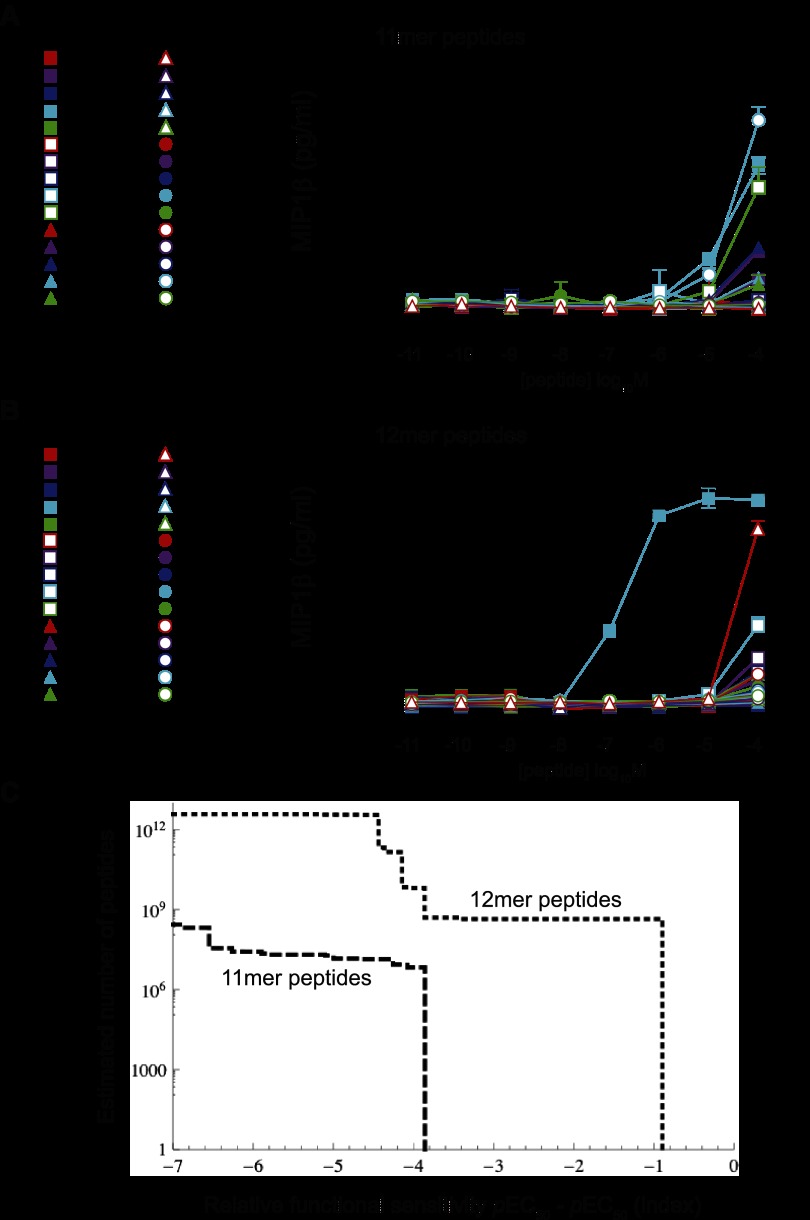
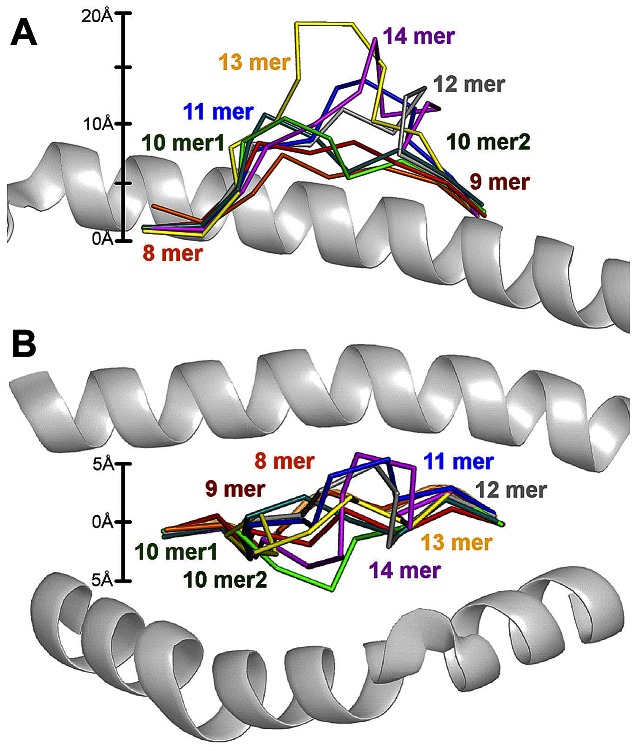
αβ-TCRs expressed at the CD8(+) T-cell surface interact with short peptide fragments (p) bound to MHC class I molecules (pMHCI). The TCR/pMHCI interaction is pivotal in all aspects of CD8(+) T-cell immunity. However, the rules that govern the outcome of TCR/pMHCI engagement are not entirely understood, and this is a major barrier to understanding the requirements for both effective immunity and vaccination. In the present study, we discovered an unexpected feature of the TCR/pMHCI interaction by showing that any given TCR exhibits an explicit preference for a single MHCI-peptide length. Agonists of nonpreferred length were extremely rare, suboptimal, and often entirely distinct in sequence. Structural analysis indicated that alterations in peptide length have a major impact on antigenic complexity, to which individual TCRs are unable to adapt. This novel finding demonstrates that the outcome of TCR/pMHCI engagement is determined by peptide length in addition to the sequence identity of the MHCI-bound peptide. Accordingly, the effective recognition of pMHCI Ag, which is a prerequisite for successful CD8(+) T-cell immunity and protective vaccination, can only be achieved by length-matched Ag-specific CD8(+) T-cell clonotypes.
Figures

Similar articles
-
MHC class I molecules with Superenhanced CD8 binding properties bypass the requirement for cognate TCR recognition and nonspecifically activate CTLs.J Immunol. 2010 Apr 1;184(7):3357-66. doi: 10.4049/jimmunol.0902398. Epub 2010 Feb 26. J Immunol. 2010. PMID: 20190139 Free PMC article.
-
A conserved energetic footprint underpins recognition of human leukocyte antigen-E by two distinct αβ T cell receptors.J Biol Chem. 2017 Dec 22;292(51):21149-21158. doi: 10.1074/jbc.M117.807719. Epub 2017 Sep 25. J Biol Chem. 2017. PMID: 28972140 Free PMC article.
-
T cell receptor engagement of peptide-major histocompatibility complex class I does not modify CD8 binding.Mol Immunol. 2008 May;45(9):2700-9. doi: 10.1016/j.molimm.2007.12.009. Epub 2008 Feb 19. Mol Immunol. 2008. PMID: 18243322
-
T cell antigen receptor recognition of antigen-presenting molecules.Annu Rev Immunol. 2015;33:169-200. doi: 10.1146/annurev-immunol-032414-112334. Epub 2014 Dec 10. Annu Rev Immunol. 2015. PMID: 25493333 Review.
-
HLAs, TCRs, and KIRs, a Triumvirate of Human Cell-Mediated Immunity.Annu Rev Biochem. 2020 Jun 20;89:717-739. doi: 10.1146/annurev-biochem-011520-102754. Annu Rev Biochem. 2020. PMID: 32569519 Review.
Cited by
-
The T cell antigen receptor: the Swiss army knife of the immune system.Clin Exp Immunol. 2015 Jul;181(1):1-18. doi: 10.1111/cei.12622. Epub 2015 May 14. Clin Exp Immunol. 2015. PMID: 25753381 Free PMC article. Review.
-
Peptide Super-Agonist Enhances T-Cell Responses to Melanoma.Front Immunol. 2019 Mar 13;10:319. doi: 10.3389/fimmu.2019.00319. eCollection 2019. Front Immunol. 2019. PMID: 30930889 Free PMC article.
-
Role of T cell receptor affinity in the efficacy and specificity of adoptive T cell therapies.Front Immunol. 2013 Aug 21;4:244. doi: 10.3389/fimmu.2013.00244. eCollection 2013. Front Immunol. 2013. PMID: 23970885 Free PMC article.
-
Revealing factors determining immunodominant responses against dominant epitopes.Immunogenetics. 2020 Feb;72(1-2):109-118. doi: 10.1007/s00251-019-01134-9. Epub 2019 Dec 6. Immunogenetics. 2020. PMID: 31811313 Free PMC article. Review.
-
Structural Mechanism Underpinning Cross-reactivity of a CD8+ T-cell Clone That Recognizes a Peptide Derived from Human Telomerase Reverse Transcriptase.J Biol Chem. 2017 Jan 20;292(3):802-813. doi: 10.1074/jbc.M116.741603. Epub 2016 Nov 30. J Biol Chem. 2017. PMID: 27903649 Free PMC article.
References
-
- Shortman K, Egerton M, Spangrude GJ, Scollay R. The generation and fate of thymocytes. Semin Immunol. 1990;2(1):3–12. - PubMed
-
- Lieber MR. Site-specific recombination in the immune system. FASEB J. 1991;5(14):2934–2944. - PubMed
-
- Davis SJ, Ikemizu S, Evans EJ, Fugger L, Bakker TR, van der Merwe PA. The nature of molecular recognition by T cells. Nat Immunol. 2003;4(3):217–224. - PubMed
-
- Arstila TP, Casrouge A, Baron V, Even J, Kanellopoulos J, Kourilsky P. A direct estimate of the human alphabeta T cell receptor diversity. Science. 1999;286(5441):958–961. - PubMed
-
- Arstila TP, Casrouge A, Baron V, Even J, Kanellopoulos J, Kourilsky P. Diversity of human alpha beta T cell receptors. Science. 2000;288(5469):1135. - PubMed
Publication types
MeSH terms
Substances
Grants and funding
LinkOut - more resources
Full Text Sources
Other Literature Sources
Molecular Biology Databases
Research Materials
