. 2013 Feb 1;288(5):3112-25.
doi: 10.1074/jbc.M112.404624. Epub 2012 Dec 19.

Adiponectin receptors form homomers and heteromers exhibiting distinct ligand binding and intracellular signaling properties

Affiliations

Adiponectin receptors form homomers and heteromers exhibiting distinct ligand binding and intracellular signaling properties

Farid Almabouada et al. J Biol Chem. .

Abstract

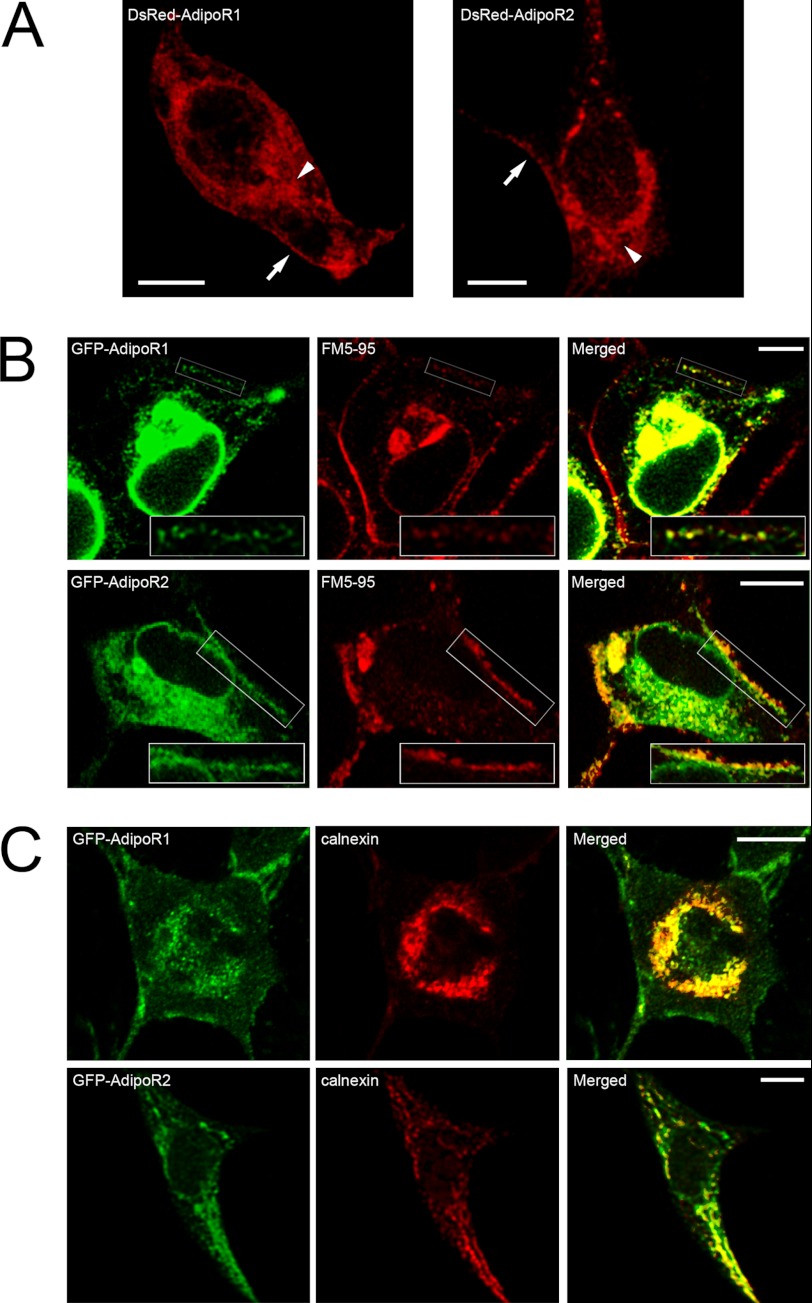
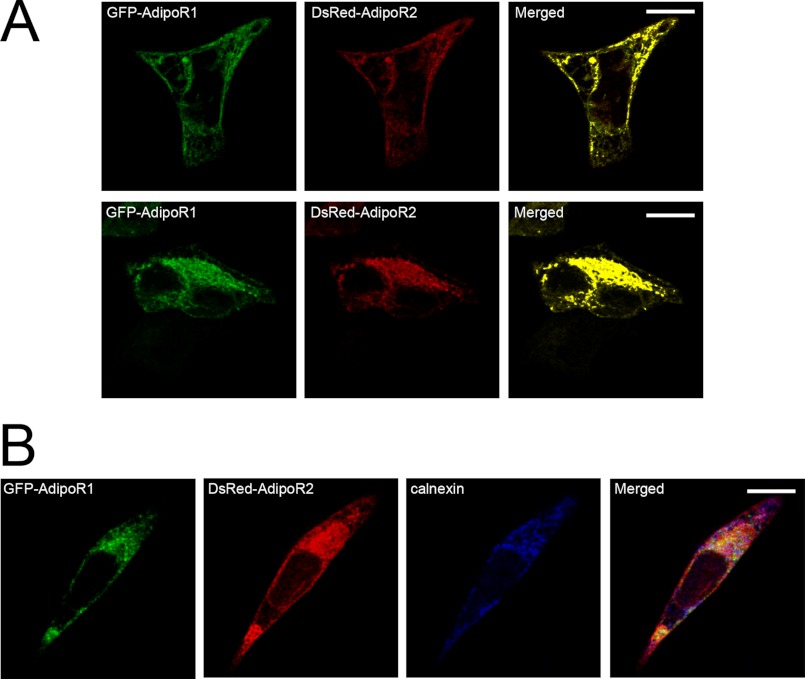
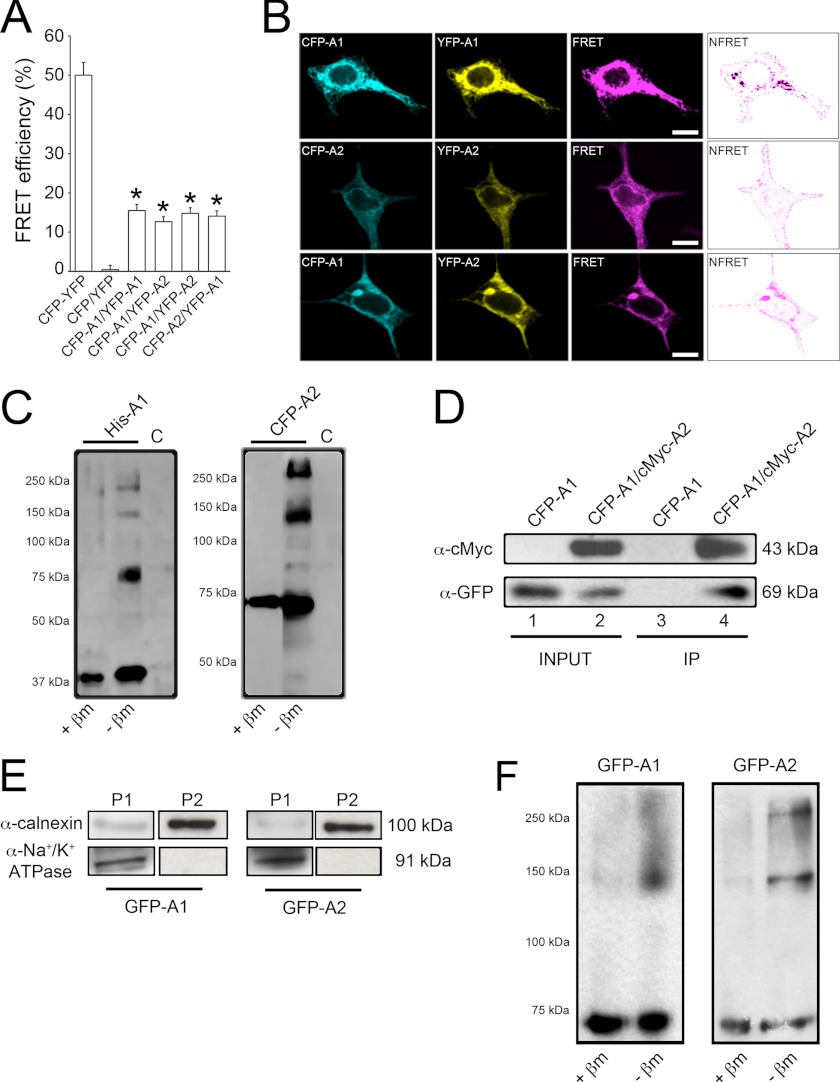
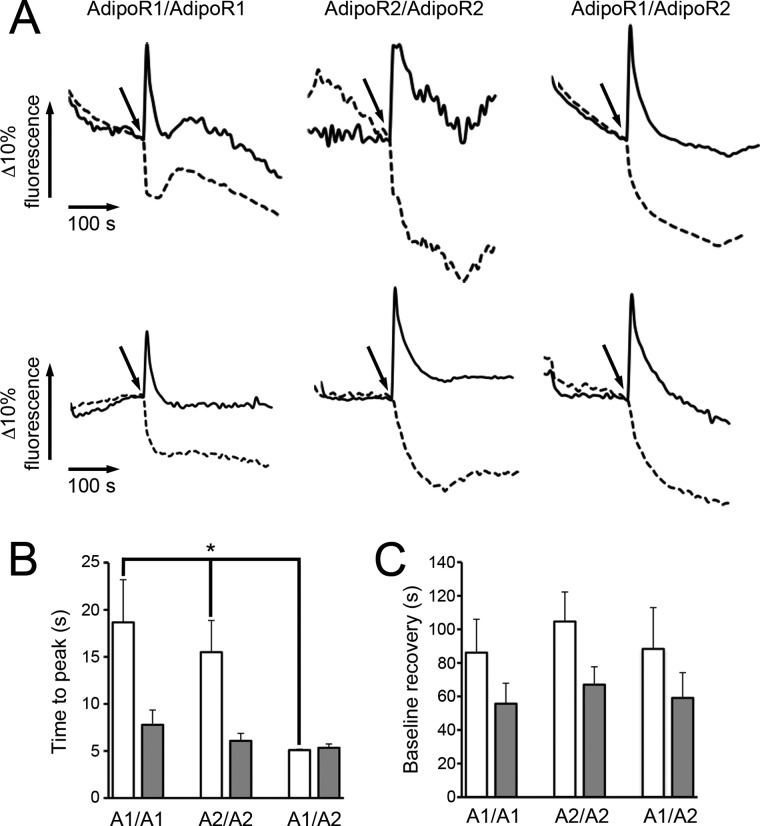
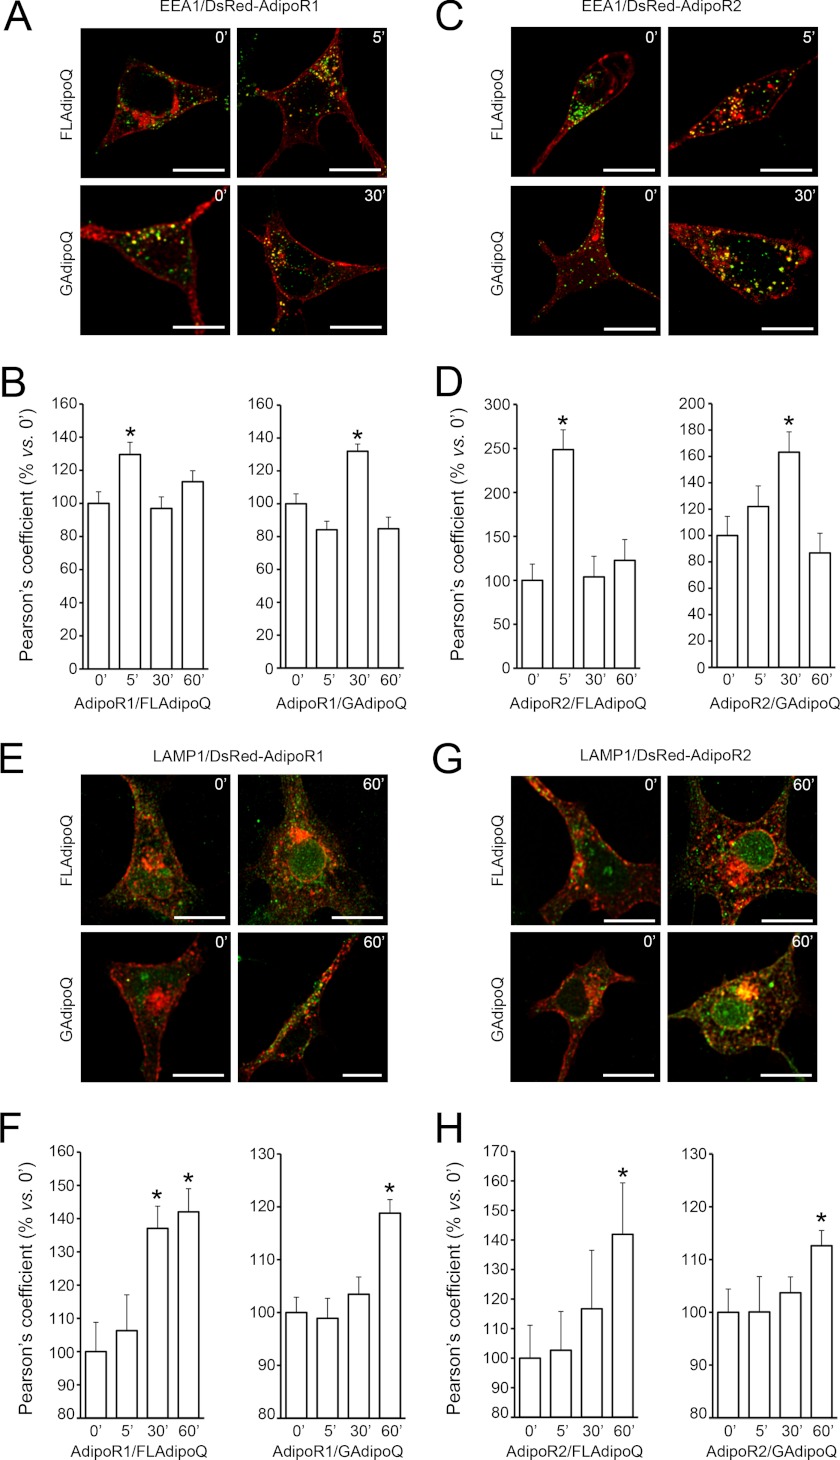
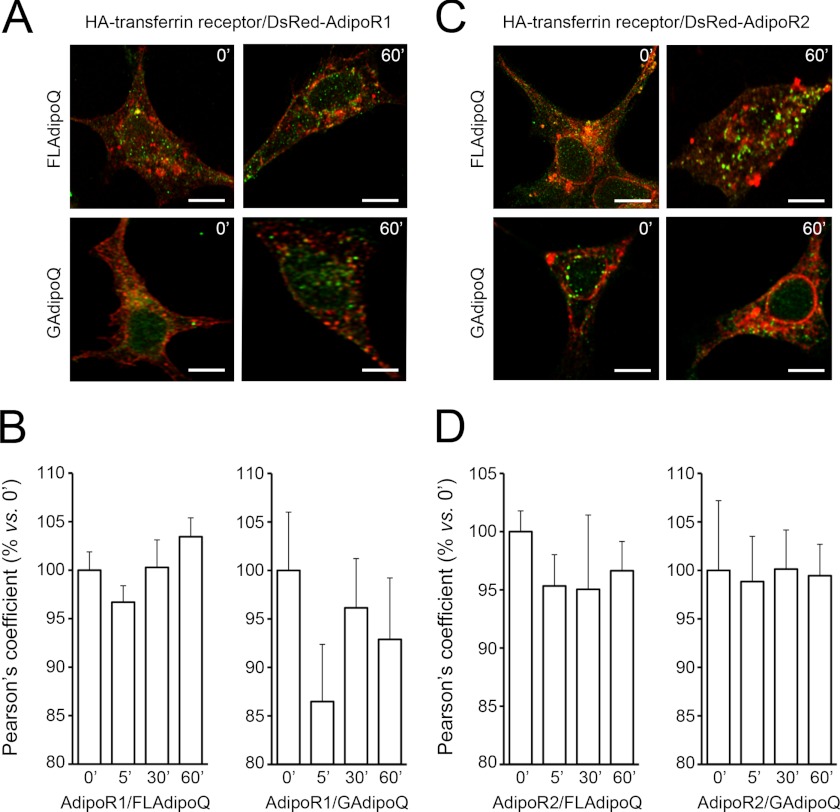
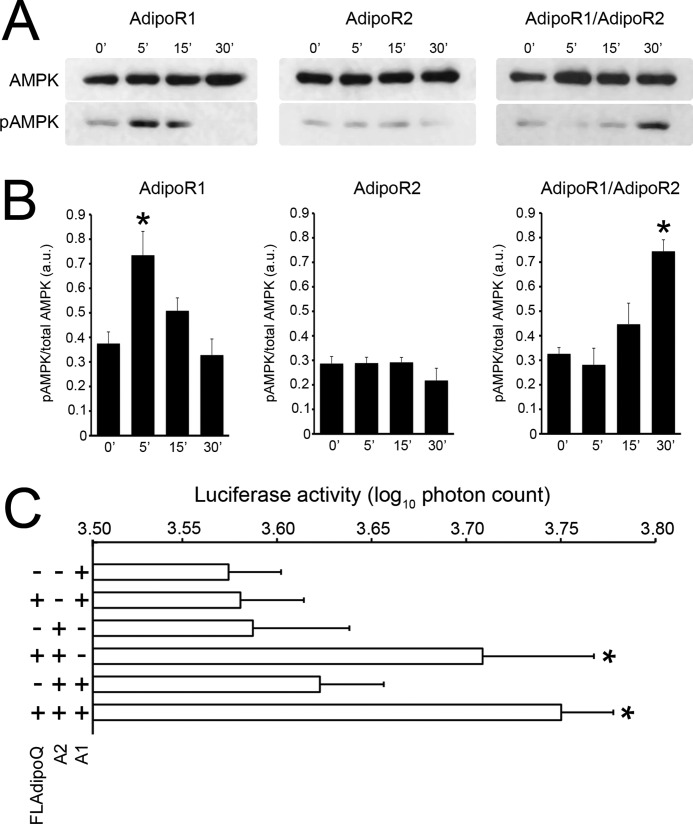
Adiponectin binds to two widely expressed receptors (AdipoR1 and AdipoR2) that contain seven transmembrane domains but, unlike G-protein coupled receptors, present an extracellular C terminus and a cytosolic N terminus. Recently, AdipoR1 was found to associate in high order complexes. However, it is still unknown whether AdipoR2 may also form homomers or heteromers with AdipoR1 or if such interactions may be functionally relevant. Herein, we have analyzed the oligomerization pattern of AdipoRs by FRET and immunoprecipitation and evaluated both the internalization of AdipoRs in response to various adiponectin isoforms and the effect of adiponectin binding to different AdipoR combinations on AMP-activated protein kinase phosphorylation and peroxisome proliferator-activated receptor α activation. Transfection of HEK293AD cells with AdipoR1 and AdipoR2 showed that both receptors colocalize at both the plasma membrane and the endoplasmic reticulum. Co-transfection with the different AdipoR pairs yielded high FRET efficiencies in non-stimulated cells, which indicates that AdipoR1 and AdipoR2 form homo- and heteromeric complexes under resting conditions. Live FRET imaging suggested that both homo- and heteromeric AdipoR complexes dissociate in response to adiponectin, but heteromers separate faster than homomers. Finally, phosphorylation of AMP-activated protein kinase in response to adiponectin was delayed in cells wherein heteromer formation was favored. In sum, our findings indicate that AdipoR1 and AdipoR2 form homo- and heteromers that present unique interaction behaviors and signaling properties. This raises the possibility that the pleiotropic, tissue-dependent functions of adiponectin depend on the expression levels of AdipoR1 and AdipoR2 and, therefore, on the steady-state proportion of homo- and heteromeric complexes.


Figures

FIGURE 1.
FIGURE 1.
Intracellular localization of fluorescently tagged AdipoR1 and AdipoR2 in HEK293AD cells. A, representative confocal images of HEK293AD cells expressing DsRed-AdipoR1 (left panel) or DsRed-AdipoR2 (right panel) are shown. AdipoR1 and AdipoR2 fluorescent signals accumulate in close apposition to the plasma membrane (arrows) as well as in an intracellular compartment surrounding the nucleus (arrowheads). B, shown is colocalization of GFP-AdipoR1 or GFP-AdipoR2 (green) with the plasma membrane marker FM5–95 (red). As shown in the rightmost panels, both AdipoR1 and AdipoR2 signals exhibit significant overlapping with FM5–95 at the plasma membrane. C, shown is colocalization analysis of GFP-tagged AdipoR1 and AdipoR2 (green) with the ER marker calnexin (red). Intracellular accumulation of AdipoR1 and AdipoR2 strongly coincides with calnexin immunosignal. Scale bars, 5 μm.
FIGURE 2.
FIGURE 2.
Colocalization of exogenously expressed AdipoR1 and AdipoR2. A, co-transfection of HEK293AD cells with GFP-AdipoR1 (green) and DsRed-AdipoR2 (red) reveals a high degree of colocalization along the plasma membrane (top panels) as well as in the ER (bottom panels). B, triple fluorescence detection of GFP-AdipoR1 (green), DsRed-AdipoR2 (red), and the ER marker calnexin (blue) is shown. Colocalization of the three markers was found intracellularly within the ER, whereas overlapping of AdipoR1 and AdipoR2 also occurred at the plasma membrane.
FIGURE 3.
FIGURE 3.
Evaluation of AdipoR1 and AdipoR2 interaction. A, shown are measurements of FRET efficiency in fixed HEK293AD cells transfected with different ECFP and Venus-YFP constructs. FRET efficiency values were calculated as described under “Experimental Procedures.” Cells expressing ECFP and Venus-YFP coupled in-frame within the same plasmid construct were used as the positive control (46 cells). Cells expressing ECFP and Venus-YFP empty vectors were used as negative control (44 cells). FRET was measured in cells co-transfected with ECFP-AdipoR1/Venus-YFP-AdipoR1 (71 cells), ECFP-AdipoR2/Venus-YFP-AdipoR2 (67 cells), ECFP-AdipoR1/Venus-YFP-AdipoR2 (63 cells), or ECFP-AdipoR2/Venus-YFP-AdipoR1 (62 cells) under basal culture conditions. Only cells displaying Venus-YFP/ECFP ratios close to or equal to 1 were included in the analysis. Results presented are the average ± S.E. of the number of cells indicated (*, p < 0.001 versus negative control). B, shown is a PixFRET map of FRET efficiencies yielded by AdipoR homo- and heteromers. Normalized FRET (NFRET) channels (rightmost panels) reveal that protein interaction occurs mainly at the plasma membrane, although some positive signal is also present in the ER. Scale bars, 5 μm. C, protein extracts from HEK293AD cells were transfected with His6-tagged AdipoR1 (left panel) or ECFP-tagged AdipoR2 (right panel) and electrophoresed in the presence or absence of the reducing agent β-mercaptoethanol. As the control (C), cells were transfected with a construct coding for the His6 tag alone. D, immunoprecipitation (IP) of the AdipoR1/AdipoR2 complex is shown. Immunoprecipitation was carried out with lysates prepared from HEK293AD cells co-expressing the ECFP-AdipoR1/cMyc-AdipoR2 combination. For control purposes, HEK293AD cells were transfected with ECFP-AdipoR1 alone. After cell lysis, protein extracts were immunoprecipitated with monoclonal anti-cMyc antibody and then immunoblotted using anti-cMyc or anti-GFP polyclonal antibodies. Monoclonal anti-cMyc antibody co-precipitated ECFP-AdipoR2 in ECFP-AdipoR1/cMyc-AdipoR2 co-expressing cells (lane 4) but not in cells expressing ECFP-AdipoR1 alone (lane 3). E, assessment of ER membrane-enriched protein extracts by subcellular fractionation is shown. Protein extracts from GFP-AdipoR1- or GFP-AdipoR2-transfected cells were centrifuged at 600 × g for 10 min, 15,000 × g for 5 min, and 100,000 × g for 60 min. Pellets from the second (P1) and third (P2) centrifugation steps were immunostained against the ER membrane marker calnexin (top panels) and the plasma membrane marker Na+/K+-ATPase (bottom panels). F, subcellular fractionation of HEK293AD cell extracts was performed to further investigate the presence of AdipoR complexes in ER membrane-enriched fractions. ER-enriched fractions were incubated in the presence or absence of β-mercaptoethanol (βm), electrophoresed, and immunostained against GFP to identify AdipoR monomers and multimers.
FIGURE 4.
FIGURE 4.
Live FRET imaging. A, shown are time-lapse recordings of ECFP (solid lines) and Venus-YFP (dashed lines) fluorescent signals in single, living HEK293AD cells co-transfected with the different combinations of FRET constructs. ECFP and Venus-YFP fluorescent emissions were monitored under non-stimulated conditions (base line) for 120 s. Afterward, cells were treated with 100 nm FLAdipoQ (top panels) or 100 nm GAdipoQ (bottom panels), and fluorescence was recorded for an additional 200-s period. B, shown is the average time for the Venus-YFP/ECFP ratio to attain its minimal value after adiponectin administration. C, shown is the average time for Venus-YFP/ECFP ratio to regain values close to base line after adiponectin administration. Data correspond to representative examples of FRET profiles from cells exposed to FLAdipoQ and GAdipoQ (n = 15, 10, and 11 cells for AdipoR1 pairs, AdipoR2 pairs, and AdipoR1-AdipoR2 pairs, respectively, in experiments with FLAdipoQ; n = 18, 14, and 7 cells for AdipoR1 pairs, AdipoR2 pairs, and AdipoR1-AdipoR2 pairs, respectively, in experiments with GAdipoQ; n = 5 and 6 separate experiments for FLAdipoQ and GAdipoQ, respectively). *, p < 0.001 versus ECFP-AdipoR1/Venus-YFP-AdipoR1 and ECFP-AdipoR2/Venus-YFP-AdipoR2-expressing cells.
FIGURE 5.
FIGURE 5.
AdipoR1 and AdipoR2 internalization dynamics in response to adiponectin. A and C, shown are representative confocal images of HEK293AD cells expressing DsRed-AdipoR1 (A) or DsRed-AdipoR2 (C) and treated with 100 nm FLAdipoQ (left panels) or 100 nm GAdipoQ (right panels) for 0, 5, 30, and 60 min. After treatment, cells were fixed and immunostained against the early endosome marker EEA1 (green). B and D, shown is quantification of the colocalization index (Pearson's coefficient) between DsRed-AdipoR1 or DsRed-AdipoR2 and EEA1 immunofluorescent signal in FLAdipoQ (left graphs)- or GAdipoQ-treated cells (right graphs). E and G, representative confocal images of HEK293AD cells expressing DsRed-AdipoR1 (E) or DsRed-AdipoR2 (G) treated with 100 nm FLAdipoQ (left panels) or 100 nm GAdipoQ (right panels) for 0, 5, 30, and 60 min and immunostained against LAMP1 (green). F and H, shown is the colocalization index between DsRed-AdipoR1 or DsRed-AdipoR2 and LAMP1 in FLAdipoQ (left graph)- or GAdipoQ-treated cells (right graph). Data are represented as the average ± S.E. from at least 12 cells per group collected from three independent experiments. *, p < 0.05 versus untreated cells.
FIGURE 6.
FIGURE 6.
AdipoR1 and AdipoR2 internalization dynamics in response to adiponectin. A and C, shown are representative confocal images of DsRed-AdipoR1 (A)- or DsRed-AdipoR2-expressing (C) HEK293AD cells transfected with the recycling endosome marker transferrin receptor tagged with HA (green) and treated with 100 nm FLAdipoQ (left panels) or 100 nm GAdipoQ (right panels) for 0, 5, 30, and 60 min. Scale bars, 5 μm. B and D, shown is quantification of the colocalization index between DsRed-AdipoR1 or DsRed-AdipoR2 and transferrin receptor immunofluorescent signals in FLAdipoQ (left graphs)- or GAdipoQ-treated cells (right graphs). Data are presented as the average ± S.E. from at least 12 cells per group collected from 3 independent experiments.
FIGURE 7.
FIGURE 7.
Time-dependent effect of FLAdipoQ treatment on the phosphorylation of AMPK. A, shown are representative blots of HEK293AD cells expressing exogenous AdipoR1 alone (left panel), AdipoR2 alone (middle panel), or co-expressing AdipoR1 and AdipoR2 (right panel). B, shown are average band intensities of adiponectin-induced AMPK phosphorylation rates in AdipoR1 (left graph)-, AdipoR2 (middle graph)-, or AdipoR1/AdipoR2-expressing cells (right graph). AMPK phosphorylation was determined as phospho-AMPK normalized by total AMPK and are represented as the average ± S.E. from at least three independent experiments. * p < 0.001 versus untreated cells. C, PPARα activity was measured as the capacity of FLAdipoQ to increase DR1-driven luciferase synthesis. AdipoR1-, AdipoR2-, or AdipoR1/AdipoR2-expressing HepG2 cells were co-transfected with a DR1-luciferase reporter plasmid. Photon emission was assessed in single, living cells under basal conditions and after a 60-min exposure to 100 nm FLAdipoQ. Data are expressed as the log10 of the photon emission integrated in 10-min intervals and are represented as the average ± S.E. from at least 27 cells from 5 independent experiments. *, p < 0.05 versus untreated cells.

References

    1. Rajala M. W., Scherer P. E. (2003) Minireview. The adipocyte. At the crossroads of energy homeostasis, inflammation, and atherosclerosis. Endocrinology 144, 3765–3773 - PubMed
    1. Scherer P. E., Williams S., Fogliano M., Baldini G., Lodish H. F. (1995) A novel serum protein similar to C1q, produced exclusively in adipocytes. J. Biol. Chem. 270, 26746–26749 - PubMed
    1. Hu E., Liang P., Spiegelman B. M. (1996) AdipoQ is a novel adipose-specific gene dysregulated in obesity. J. Biol. Chem. 271, 10697–10703 - PubMed
    1. Maeda K., Okubo K., Shimomura I., Funahashi T., Matsuzawa Y., Matsubara K. (1996) cDNA cloning and expression of a novel adipose specific collagen-like factor, apM1 (AdiPose most abundant gene transcript 1). Biochem. Biophys. Res. Commun. 221, 286–289 - PubMed
    1. Nakano Y., Tobe T., Choi-Miura N. H., Mazda T., Tomita M. (1996) Isolation and characterization of GBP28, a novel gelatin-binding protein purified from human plasma. J. Biochem. 120, 803–812 - PubMed

Publication types

MeSH terms

LinkOut - more resources